

Question: Lab 3 Label the x axis with the years. Don't hard code the years, get them from the data file. Label the title with the
Lab Label the axis with the years. Don't hard
code the years, get them
from the data file.
Label the title with the day and years
plotted and and the subtitle with
the smoothing levels. Don't hard code the
numbers. Get the numbers from
the data file and the user input.
The nd example plot has a dark theme
which we will learn to do soon. You don't
need to do it for this assignment, but if you
want to be ambitious you can read about
MATLAB plot colors and give it a try. Example Plot:
Daily Low and High Day to
Daily Low and High Dav to
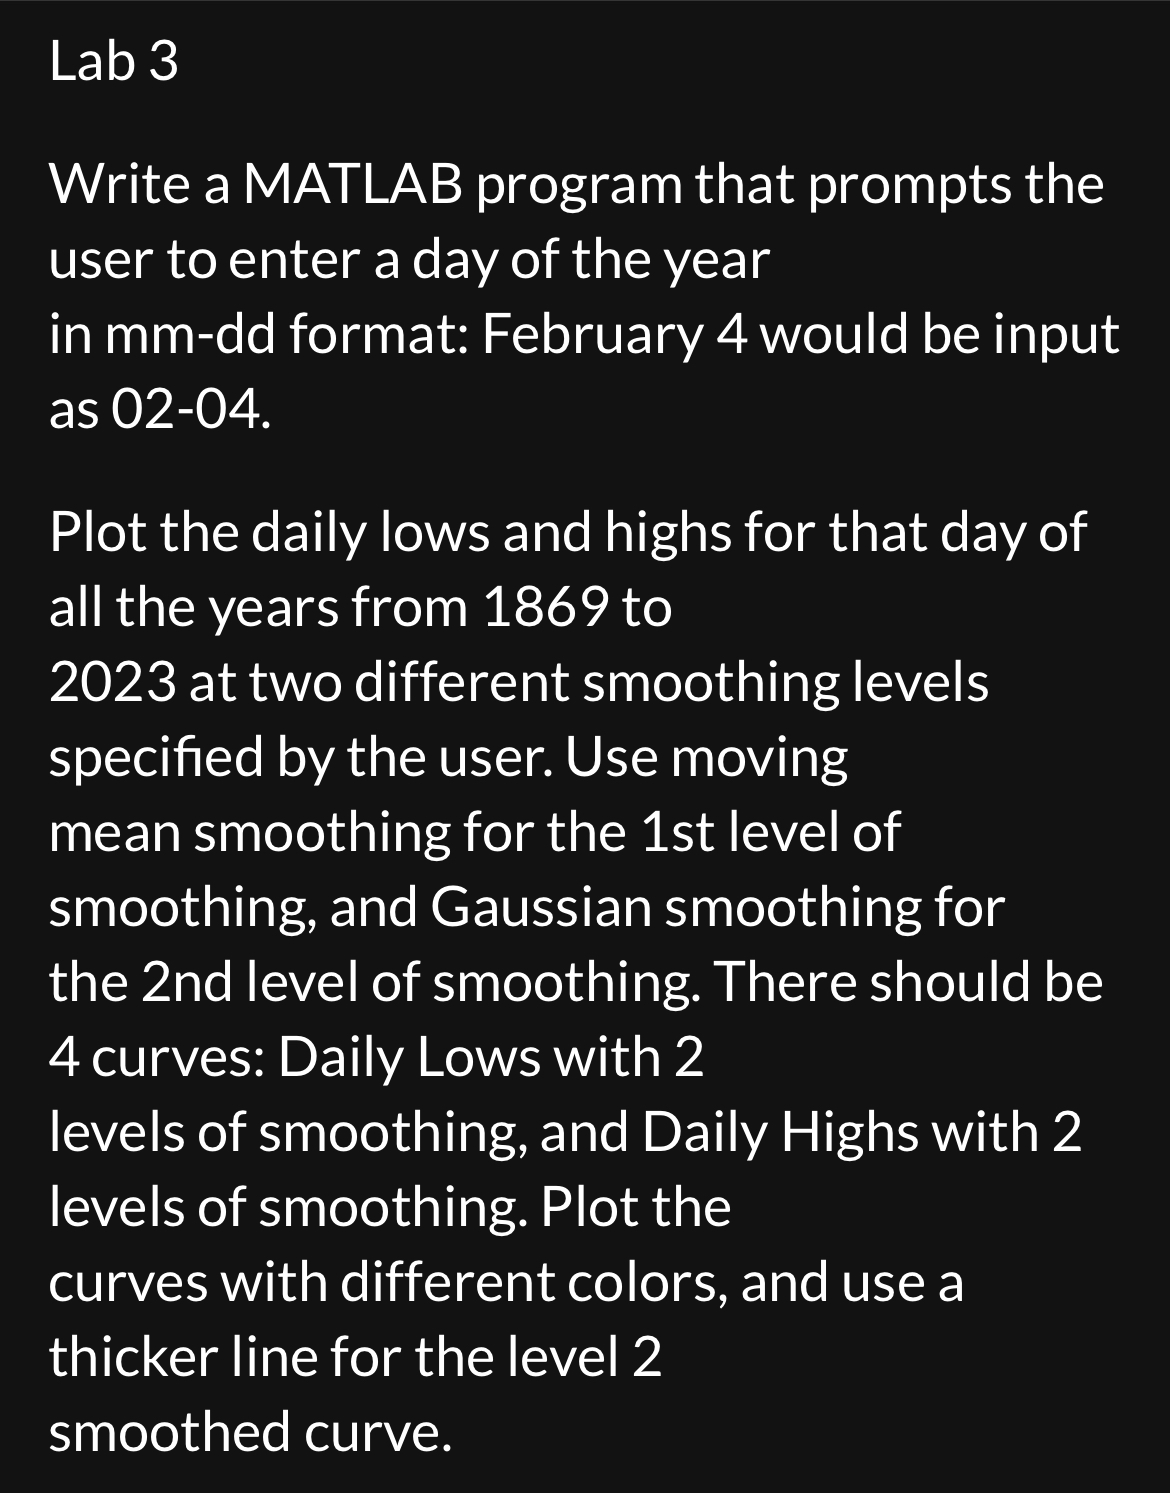
Write a MATLAB program that prompts the
user to enter a day of the year
in mmdd format: February would be input
as
Plot the daily lows and highs for that day of
all the years from to
at two different smoothing levels
specified by the user. Use moving
mean smoothing for the st level of
smoothing, and Gaussian smoothing for
the nd level of smoothing. There should be
curves: Daily Lows with
levels of smoothing, and Daily Highs with
levels of smoothing. Plot the
curves with different colors, and use a
thicker line for the level
smoothed curve.
Step by Step Solution
There are 3 Steps involved in it
1 Expert Approved Answer
Step: 1 Unlock

Question Has Been Solved by an Expert!
Get step-by-step solutions from verified subject matter experts
Step: 2 Unlock
Step: 3 Unlock