Microsoft Excel Work
Mini-Case Valuing Conoco Phillips Acquisition of Burlington Resources
Suppose that you were working as an equity analyst in 2005 and were assigned the task of valuing the proposed acquisition, which is described in the following press release:
Houston, Texas (December 12, 2005)ConocoPhillips (NYSE: COP) and Burlington Resources Inc. (NYSE: BR) announced today they have signed a definitive agreement under which ConocoPhillips will acquire Burlington Resources in a transaction valued at $33.9 billion. The transaction, upon approval by Burlington Resources shareholders, will provide ConocoPhillips with extensive, high-quality natural gas exploration and production assets, primarily located in North America. The Burlington Resources portfolio provides a strong complement to ConocoPhillips global portfolio of integrated exploration, production, refining, and energy transportation operations, thereby positioning the combined company for future growth.
In his letter to ConocoPhillips shareholders contained in the companys 2005 annual report, CEO Jim Mulva described the rationale for the proposed Burlington acquisition as follows:
Burlingtons near-term production profile is robust and growing, plus Burlington possesses an extensive inventory of prospects and significant land positions in the most promising basins in North America, primarily onshore. With this access to high-quality, long-life reserves, the acquisition enhances our production growth from both conventional and unconventional gas resources.
Specifically, our portfolio will be bolstered by opportunities to enhance production and gain operating synergies in the San Juan Basin of the United States and by an expanded presence and better utilization of our assets in Western Canada. In addition to growth possibilities, these assets also provide significant cash generation potential well into the future.
Beyond adding to production and reserves, Burlington also brings well-recognized technical expertise that, together with ConocoPhillips existing upstream capabilities, will create a superior organization to capitalize on the expanded asset base. We do not anticipate that the $33.9 billion acquisition will require asset sales within either ConocoPhillips or Burlington, nor should it change our organic growth plans for the company. We expect to achieve synergies and pretax cost savings of approximately $375 million annually, after the operations of the two companies are fully integrated.
We anticipate immediate and future cash generation from this transaction that will aid in the rapid reduction of debt incurred for the acquisition and go toward the redeployment of cash into strategic areas of growth. Burlington shareholders will vote on the proposed transaction at a meeting on March 30, 2006.

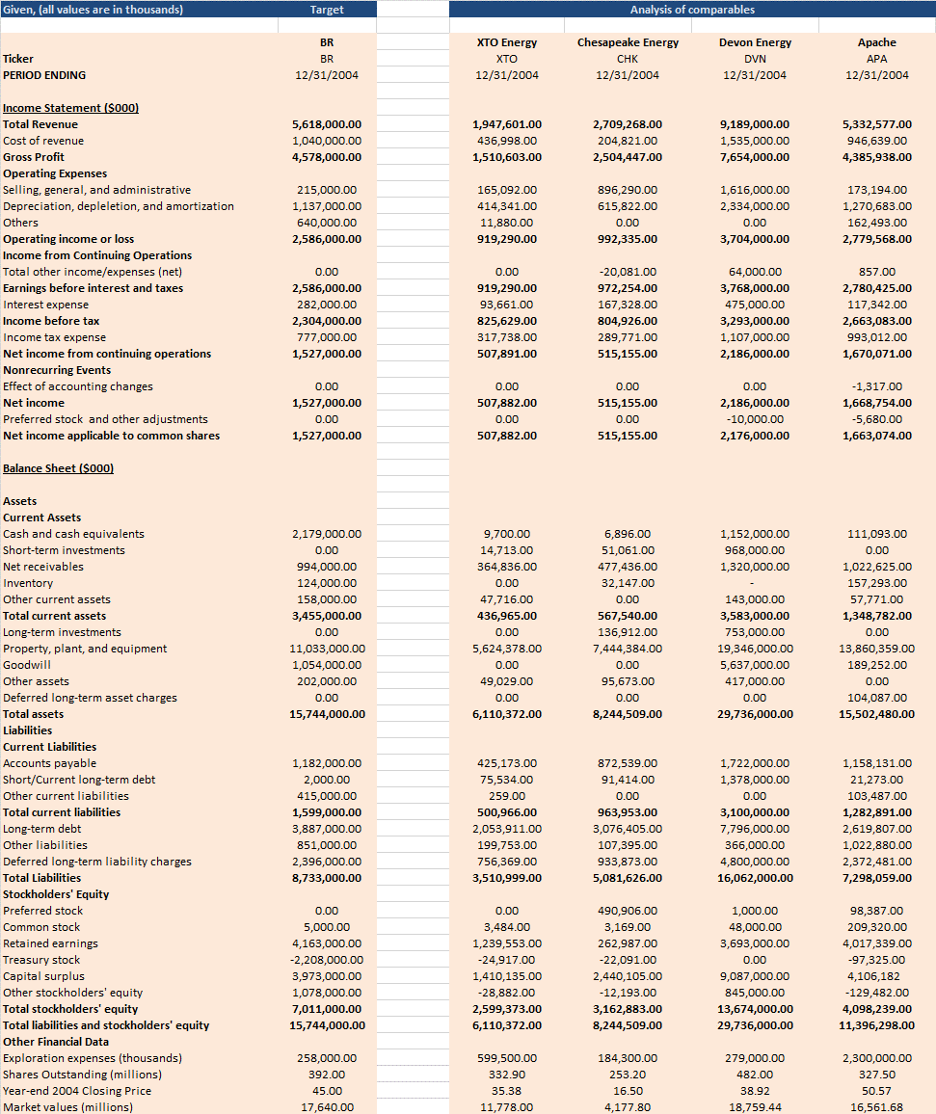
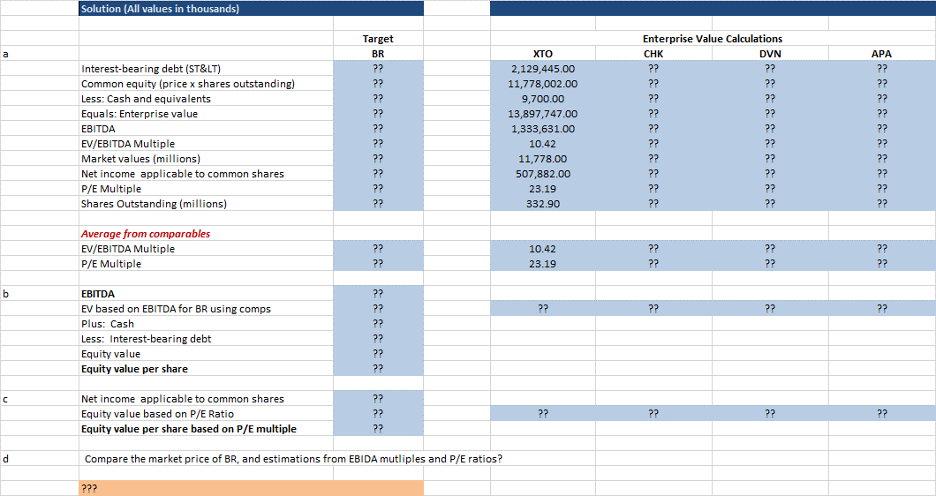
Given, (all values are in thousands) Target Analysis of comparables Ticker PERIOD ENDING BR BR 12/31/2004 XTO Energy XTO 12/31/2004 Chesapeake Energy CHK 12/31/2004 Devon Energy DVN 12/31/2004 Apache APA 12/31/2004 5,618,000.00 1,040,000.00 4,578,000.00 1,947,601.00 436,998.00 1,510,603.00 2,709,268.00 204,821.00 2,504,447.00 9,189,000.00 1,535,000.00 7,654,000.00 5,332,577.00 946,639.00 4,385,938.00 215,000.00 1,137,000.00 640,000.00 2,586,000.00 165,092.00 414,341.00 11,880.00 919,290.00 896,290.00 615,822.00 0.00 992,335.00 1,616,000.00 2,334,000.00 0.00 3,704,000.00 173,194.00 1,270,683.00 162,493.00 2,779,568.00 Income Statement (5000) Total Revenue Cost of revenue Gross Profit Operating Expenses Selling, general, and administrative Deprecia Depreciation, depleletion, and amortization Others Operating income or loss Income from Continuing Operations Total other income/expenses (net) Earnings before interest and taxes Interest expense Income before tax Income tax expense Net income from continuing operations Nonrecurring Events Effect of accounting changes Net income Preferred stock and other adjustments Net income applicable to common shares 0.00 2,586,000.00 282,000.00 2,304,000.00 777,000.00 1,527,000.00 0.00 919,290.00 93,661.00 825,629.00 317,738.00 507,891.00 -20,081.00 972,254.00 167,328.00 804,926.00 289,771.00 515,155.00 64,000.00 3,768,000.00 475,000.00 3,293,000.00 1,107,000.00 2,186,000.00 857.00 2,780,425.00 117,342.00 2,663,083.00 993,012.00 1,670,071.00 0.00 1,527,000.00 0.00 1,527,000.00 0.00 507,882.00 0.00 507,882.00 0.00 515,155.00 0.00 515,155.00 0.00 2,186,000.00 -10,000.00 2,176,000.00 -1,317.00 1,668,754.00 -5,680.00 1,663,074.00 Balance Sheet (9000) 1,152,000.00 968,000.00 1,320,000.00 Assets Current Assets Cash and cash equivalents Short-term investments Net receivables Inventory Other current assets Total current assets Long-term investments Property, plant, and equipment Goodwill Other assets Deferred long-term asset charges Total assets Liabilities aradies 2,179,000.00 0.00 994,000.00 124,000.00 158,000.00 3,455,000.00 0.00 11,033,000.00 1,054,000.00 202,000.00 0.00 15,744,000.00 9,700.00 14,713.00 364,836.00 0.00 47,716.00 436,965.00 0.00 5,624,378.00 0.00 49,029.00 0.00 6,110,372.00 6,896.00 51,061.00 477,436.00 32,147.00 0.00 567,540.00 136,912.00 7,444,384.00 0.00 95,673.00 0.00 8,244,509.00 143,000.00 3,583,000.00 753,000.00 19,346,000.00 5,637,000.00 417,000.00 0.00 29,736,000.00 111,093.00 0.00 1,022,625.00 157,293.00 57,771.00 1,348,782.00 0.00 13,860,359.00 189,252.00 0.00 104,087.00 15,502,480.00 Current Liabilities 1,182,000.00 2,000.00 415,000.00 1,599,000.00 3,887,000.00 851,000.00 2,396,000.00 8,733,000.00 425.173.00 75,534.00 259.00 500,966.00 2,053,911.00 199,753.00 756,369.00 3,510,999.00 872,539.00 91,414.00 0.00 963,953.00 3,076,405.00 107,395.00 933,873.00 5,081,626.00 1,722,000.00 1,378,000.00 0.00 3,100,000.00 7,796,000.00 366,000.00 4,800,000.00 16,062,000.00 1,158,131.00 21,273.00 103,487.00 1,282,891.00 2,619,807.00 1,022,880.00 2,372,481.00 7,298,059.00 Accounts payable Short/Current long-term debt Other current liabilities Total current liabilities Long-term debt Other liabilities Deferred long-term liability charges Total Liabilities Stockholders' Equity Preferred stock Common stock Retained earnings Treasury stock Capital surplus Other stockholders' equity Total stockholders' equity Total liabilities and stockholders' equity Other Financial Data Exploration expenses (thousands) Shares Outstanding (millions) Year-end 2004 Closing Price Market values (millions) 0.00 5,000.00 4,163,000.00 -2,208,000.00 3,973,000.00 1,078,000.00 7,011,000.00 15,744,000.00 0.00 3,484.00 1,239,553.00 -24,917.00 1,410,135.00 -28,882.00 2,599,373.00 6,110,372.00 490,906.00 3,169.00 262,987.00 -22,091.00 2,440,105.00 -12,193.00 3,162,883.00 8,244,509.00 1,000.00 48,000.00 3,693,000.00 0.00 9,087,000.00 845,000.00 13,674,000.00 29,736,000.00 98,387.00 209,320.00 4,017,339.00 -97,325.00 4,106,182 -129,482.00 4,098,239.00 11,396,298.00 258,000.00 392.00 45.00 17,640.00 599,500.00 332.90 35.38 11,778.00 184,300.00 253.20 16.50 4,177.80 279,000.00 482.00 38.92 18,759.44 2,300,000.00 327.50 50.57 16,561.68 Solution (All values in thousands) a Interest-bearing debt (ST<) Common equity (price x shares outstanding) Less: Cash and equivalents Equals: Enterprise value EBITDA EV/EBITDA Multiple Market values (millions) Net income applicable to common shares P/E Multiple Shares Outstanding (millions) Target BR ?? ?? ?? ?? ?? ?? 29 ?? ?? ?? XTO 2,129,445.00 11,778,002.00 9,700.00 13,897,747.00 1,333,631.00 10.42 11,778.00 507,882.00 23.19 332.90 Enterprise Value Calculations CHK DVN ?? ?? ?? ?? ?? ?? ?? ?? ?? ?? ?? ?? ?? ?? ?? ?? ?? ?? ?? ?? APA ?? ?? ?? ?? ?? ?? ?? ?? ?? ?? Average from comparables EV/EBITDA Multiple P/E Multiple ?? ?? 10.42 23.19 ?? ?? ?? ?? ?? ?? b ?? ?? ?? ?? EBITDA Ev based on EBITDA for BR using comps Plus: Cash Less: Interest-bearing debt Equity value Equity value per share Net income applicable to common shares Equity value based on P/E Ratio Equity value per share based on P/E multiple ?? ?? ?? ?? ?? ?? ?? ?? ?? ?? ?? ?? ?? d Compare the market price of BR, and estimations from EBIDA mutliples and P/E ratios? ??? Given, (all values are in thousands) Target Analysis of comparables Ticker PERIOD ENDING BR BR 12/31/2004 XTO Energy XTO 12/31/2004 Chesapeake Energy CHK 12/31/2004 Devon Energy DVN 12/31/2004 Apache APA 12/31/2004 5,618,000.00 1,040,000.00 4,578,000.00 1,947,601.00 436,998.00 1,510,603.00 2,709,268.00 204,821.00 2,504,447.00 9,189,000.00 1,535,000.00 7,654,000.00 5,332,577.00 946,639.00 4,385,938.00 215,000.00 1,137,000.00 640,000.00 2,586,000.00 165,092.00 414,341.00 11,880.00 919,290.00 896,290.00 615,822.00 0.00 992,335.00 1,616,000.00 2,334,000.00 0.00 3,704,000.00 173,194.00 1,270,683.00 162,493.00 2,779,568.00 Income Statement (5000) Total Revenue Cost of revenue Gross Profit Operating Expenses Selling, general, and administrative Deprecia Depreciation, depleletion, and amortization Others Operating income or loss Income from Continuing Operations Total other income/expenses (net) Earnings before interest and taxes Interest expense Income before tax Income tax expense Net income from continuing operations Nonrecurring Events Effect of accounting changes Net income Preferred stock and other adjustments Net income applicable to common shares 0.00 2,586,000.00 282,000.00 2,304,000.00 777,000.00 1,527,000.00 0.00 919,290.00 93,661.00 825,629.00 317,738.00 507,891.00 -20,081.00 972,254.00 167,328.00 804,926.00 289,771.00 515,155.00 64,000.00 3,768,000.00 475,000.00 3,293,000.00 1,107,000.00 2,186,000.00 857.00 2,780,425.00 117,342.00 2,663,083.00 993,012.00 1,670,071.00 0.00 1,527,000.00 0.00 1,527,000.00 0.00 507,882.00 0.00 507,882.00 0.00 515,155.00 0.00 515,155.00 0.00 2,186,000.00 -10,000.00 2,176,000.00 -1,317.00 1,668,754.00 -5,680.00 1,663,074.00 Balance Sheet (9000) 1,152,000.00 968,000.00 1,320,000.00 Assets Current Assets Cash and cash equivalents Short-term investments Net receivables Inventory Other current assets Total current assets Long-term investments Property, plant, and equipment Goodwill Other assets Deferred long-term asset charges Total assets Liabilities aradies 2,179,000.00 0.00 994,000.00 124,000.00 158,000.00 3,455,000.00 0.00 11,033,000.00 1,054,000.00 202,000.00 0.00 15,744,000.00 9,700.00 14,713.00 364,836.00 0.00 47,716.00 436,965.00 0.00 5,624,378.00 0.00 49,029.00 0.00 6,110,372.00 6,896.00 51,061.00 477,436.00 32,147.00 0.00 567,540.00 136,912.00 7,444,384.00 0.00 95,673.00 0.00 8,244,509.00 143,000.00 3,583,000.00 753,000.00 19,346,000.00 5,637,000.00 417,000.00 0.00 29,736,000.00 111,093.00 0.00 1,022,625.00 157,293.00 57,771.00 1,348,782.00 0.00 13,860,359.00 189,252.00 0.00 104,087.00 15,502,480.00 Current Liabilities 1,182,000.00 2,000.00 415,000.00 1,599,000.00 3,887,000.00 851,000.00 2,396,000.00 8,733,000.00 425.173.00 75,534.00 259.00 500,966.00 2,053,911.00 199,753.00 756,369.00 3,510,999.00 872,539.00 91,414.00 0.00 963,953.00 3,076,405.00 107,395.00 933,873.00 5,081,626.00 1,722,000.00 1,378,000.00 0.00 3,100,000.00 7,796,000.00 366,000.00 4,800,000.00 16,062,000.00 1,158,131.00 21,273.00 103,487.00 1,282,891.00 2,619,807.00 1,022,880.00 2,372,481.00 7,298,059.00 Accounts payable Short/Current long-term debt Other current liabilities Total current liabilities Long-term debt Other liabilities Deferred long-term liability charges Total Liabilities Stockholders' Equity Preferred stock Common stock Retained earnings Treasury stock Capital surplus Other stockholders' equity Total stockholders' equity Total liabilities and stockholders' equity Other Financial Data Exploration expenses (thousands) Shares Outstanding (millions) Year-end 2004 Closing Price Market values (millions) 0.00 5,000.00 4,163,000.00 -2,208,000.00 3,973,000.00 1,078,000.00 7,011,000.00 15,744,000.00 0.00 3,484.00 1,239,553.00 -24,917.00 1,410,135.00 -28,882.00 2,599,373.00 6,110,372.00 490,906.00 3,169.00 262,987.00 -22,091.00 2,440,105.00 -12,193.00 3,162,883.00 8,244,509.00 1,000.00 48,000.00 3,693,000.00 0.00 9,087,000.00 845,000.00 13,674,000.00 29,736,000.00 98,387.00 209,320.00 4,017,339.00 -97,325.00 4,106,182 -129,482.00 4,098,239.00 11,396,298.00 258,000.00 392.00 45.00 17,640.00 599,500.00 332.90 35.38 11,778.00 184,300.00 253.20 16.50 4,177.80 279,000.00 482.00 38.92 18,759.44 2,300,000.00 327.50 50.57 16,561.68 Solution (All values in thousands) a Interest-bearing debt (ST<) Common equity (price x shares outstanding) Less: Cash and equivalents Equals: Enterprise value EBITDA EV/EBITDA Multiple Market values (millions) Net income applicable to common shares P/E Multiple Shares Outstanding (millions) Target BR ?? ?? ?? ?? ?? ?? 29 ?? ?? ?? XTO 2,129,445.00 11,778,002.00 9,700.00 13,897,747.00 1,333,631.00 10.42 11,778.00 507,882.00 23.19 332.90 Enterprise Value Calculations CHK DVN ?? ?? ?? ?? ?? ?? ?? ?? ?? ?? ?? ?? ?? ?? ?? ?? ?? ?? ?? ?? APA ?? ?? ?? ?? ?? ?? ?? ?? ?? ?? Average from comparables EV/EBITDA Multiple P/E Multiple ?? ?? 10.42 23.19 ?? ?? ?? ?? ?? ?? b ?? ?? ?? ?? EBITDA Ev based on EBITDA for BR using comps Plus: Cash Less: Interest-bearing debt Equity value Equity value per share Net income applicable to common shares Equity value based on P/E Ratio Equity value per share based on P/E multiple ?? ?? ?? ?? ?? ?? ?? ?? ?? ?? ?? ?? ?? d Compare the market price of BR, and estimations from EBIDA mutliples and P/E ratios


