

Question: Name: Period: Date: Lesson 10.3: Confidence Interval for Paired Data Check Your Understanding Researchers designed an experiment to study the effects of caffeine withdrawal. They
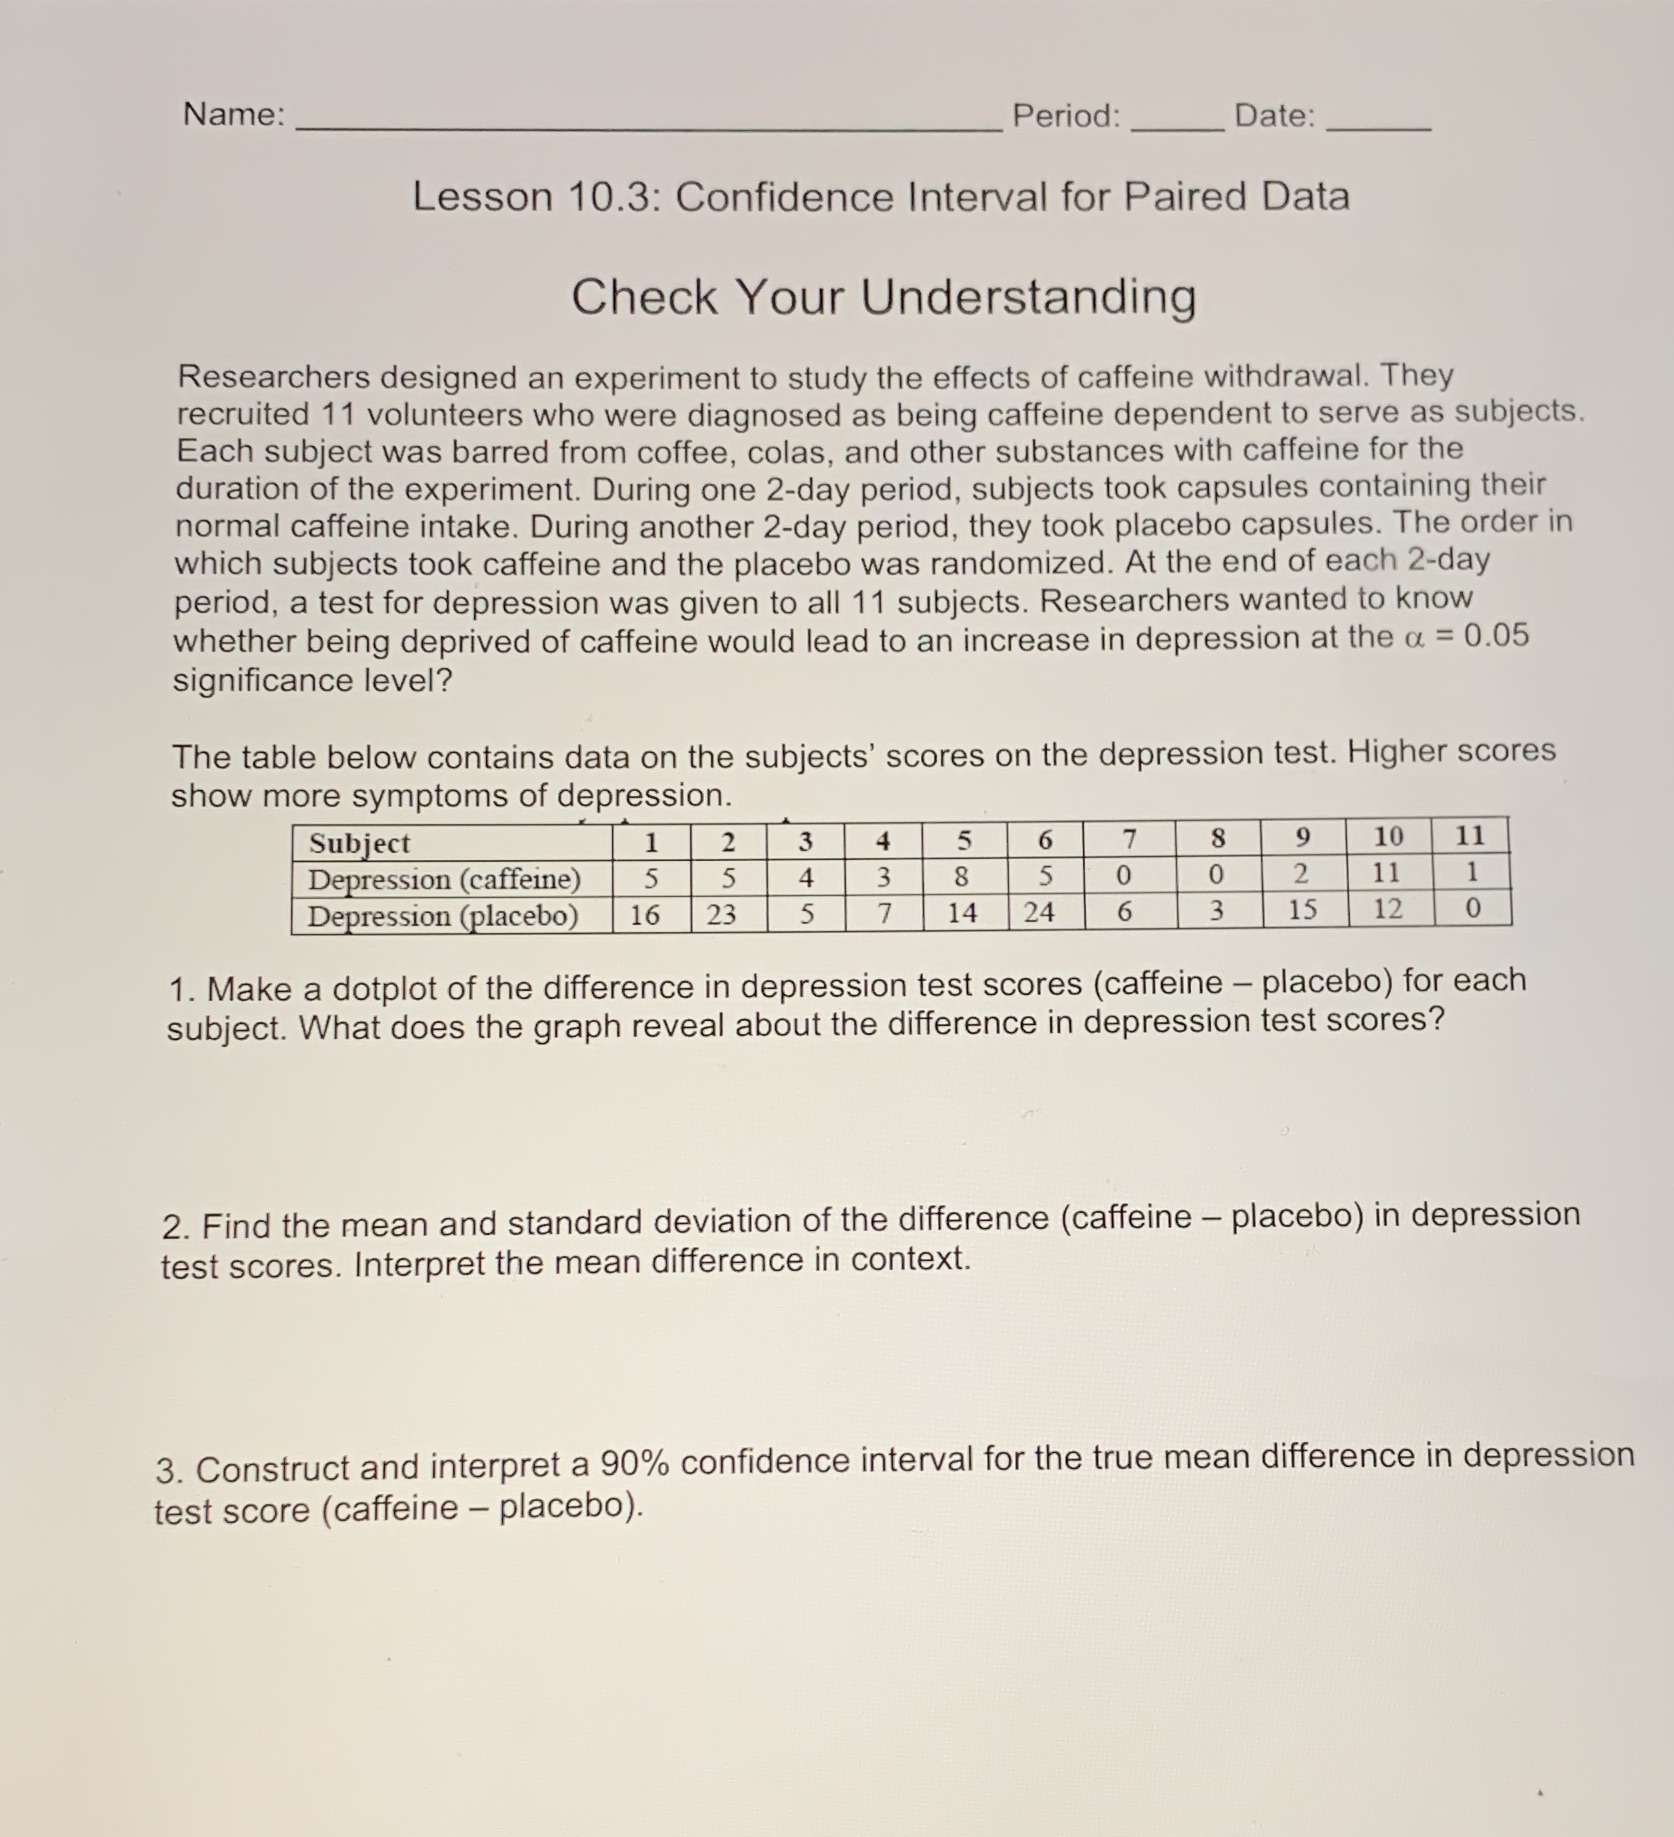
Name: Period: Date: Lesson 10.3: Confidence Interval for Paired Data Check Your Understanding Researchers designed an experiment to study the effects of caffeine withdrawal. They recruited 11 volunteers who were diagnosed as being caffeine dependent to serve as subjects. Each subject was barred from coffee, colas, and other substances with caffeine for the duration of the experiment. During one 2-day period, subjects took capsules containing their normal caffeine intake. During another 2-day period, they took placebo capsules. The order in which subjects took caffeine and the placebo was randomized. At the end of each 2-day period, a test for depression was given to all 11 subjects. Researchers wanted to know whether being deprived of caffeine would lead to an increase in depression at the a = 0.05 significance level? The table below contains data on the subjects' scores on the depression test. Higher scores show more symptoms of depression. Subject 3 4 5 6 8 9 10 11 Depression (caffeine) 8 5 0 11 Depression (placebo) 16 23 14 24 6 15 12 0 1. Make a dotplot of the difference in depression test scores (caffeine - placebo) for each subject. What does the graph reveal about the difference in depression test scores? 2. Find the mean and standard deviation of the difference (caffeine - placebo) in depression test scores. Interpret the mean difference in context. 3. Construct and interpret a 90% confidence interval for the true mean difference in depression test score (caffeine - placebo)
Step by Step Solution
There are 3 Steps involved in it

Get step-by-step solutions from verified subject matter experts