

Answered step by step
Verified Expert Solution
Question
1 Approved Answer
Ok. Hopefully you finish it soon 2. The aim of this problem is to help you learn some of the CPU scheduling algorithm discussed in
Ok. Hopefully you finish it soon
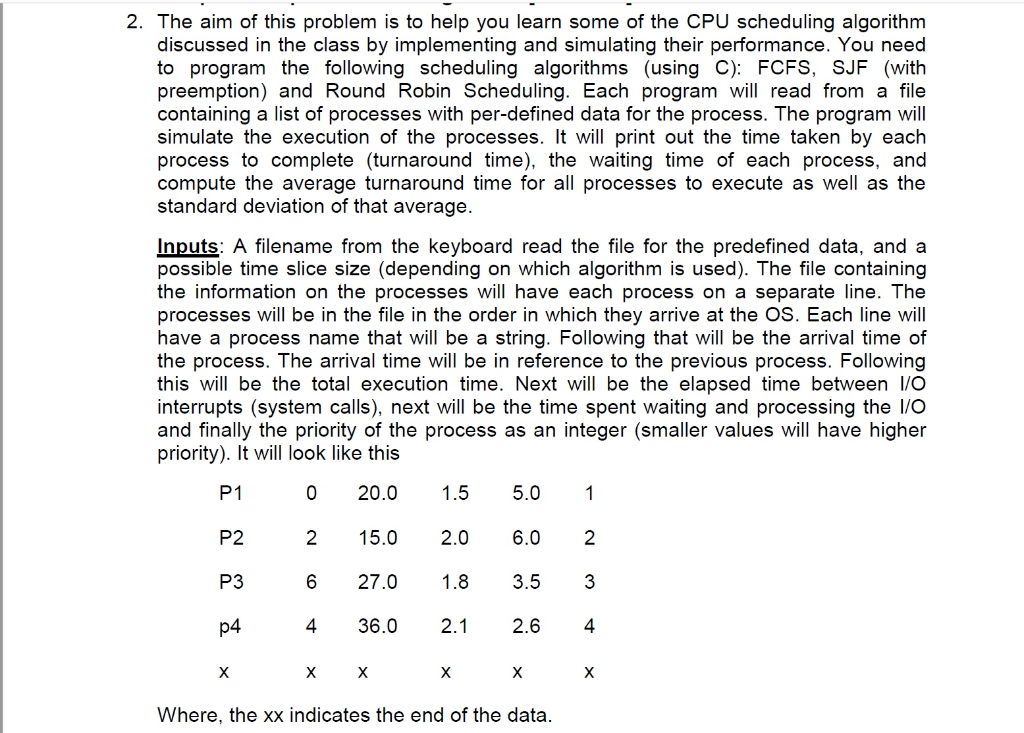
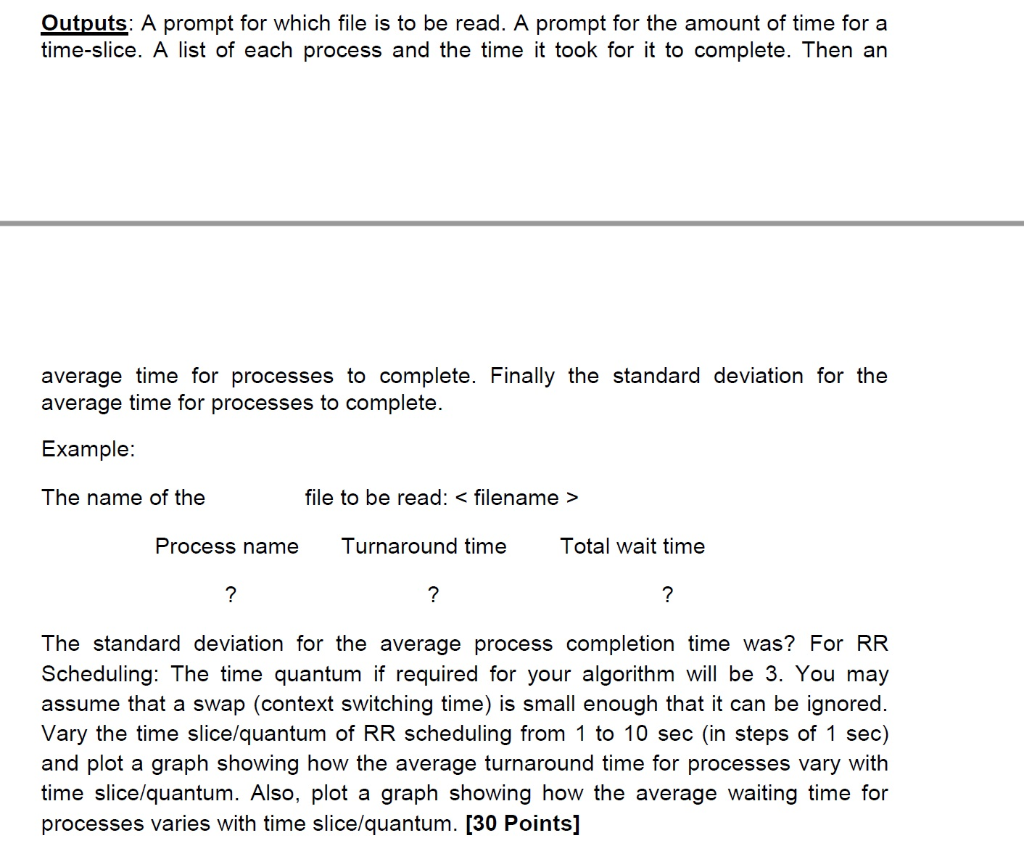
2. The aim of this problem is to help you learn some of the CPU scheduling algorithm discussed in the class by implementing and simulating their performance. You need to program the following scheduling algorithms (using C: FCFS, SJF (with preemption) and Round Robin Scheduling. Each program will read from a file containing a list of processes with per-defined data for the process. The program will simulate the execution of the processes. It will print out the time taken by each process to complete (turnaround time), the waiting time of each process, and compute the average turnaround time for all processes to execute as well as the standard deviation of that average Inputs: A filename from the keyboard read the file for the predefined data, and a possible time slice size (depending on which algorithm is used). The file containing e information on the processes Will have each process on a separate line. The processes will be in the file in the order in which they arrive at the OS. Each line will have a process name that will be a string. Following that will be the arrival time of the process. The arrival time will be in reference to the previous process. Following this will be the total execution time. Next wil be the elapsed time between I/O interrupts (system calls), next will be the time spent waiting and processing the l/O and finally the priority of the process as an integer (smaller values will have higher priority). It will look like this P1 P2 P3 4 0 20.0 1.5 5.0 1 2 15.0 2.0 6.0 2 6 27.0 1.8 3.5 3 4 36.0 2 2.6 4 Where, the xx indicates the end of the data Outputs: A prompt for which file is to be read. A prompt for the amount of time for a time-slice. A list of each process and the time it took for it to complete. Then an average time for processes to complete. Finally the standard deviation for the average time for processes to complete. Example: The name of the file to be read: Process name Turnaround time Total wait time The standard deviation for the average process completion time was? For RR Scheduling: The time quantum if required for your algorithm will be 3. You may assume that a swap (context switching time) is small enough that it can be ignored. Vary the time slice/quantum of RR scheduling from 1 to 10 sec (in steps of 1 sec) and plot a graph showing how the average turnaround time for processes vary with time slice/quantum. Also, plot a graph showing how the average waiting time for processes varies with time slice/quantum. [30 Points]Step by Step Solution
There are 3 Steps involved in it
Step: 1

Get Instant Access to Expert-Tailored Solutions
See step-by-step solutions with expert insights and AI powered tools for academic success
Step: 2

Step: 3
Ace Your Homework with AI
Get the answers you need in no time with our AI-driven, step-by-step assistance
Get Started
Advances In Database Technology Edbt 94 4th International Conference On Extending Database Technology Cambridge United Kingdom March 1994 Proceedings Lncs 779
Authors: Matthias Jarke ,Janis Bubenko ,Keith Jeffery
1994th Edition
3540578188, 978-3540578185