Answered step by step
Verified Expert Solution
Question
1 Approved Answer
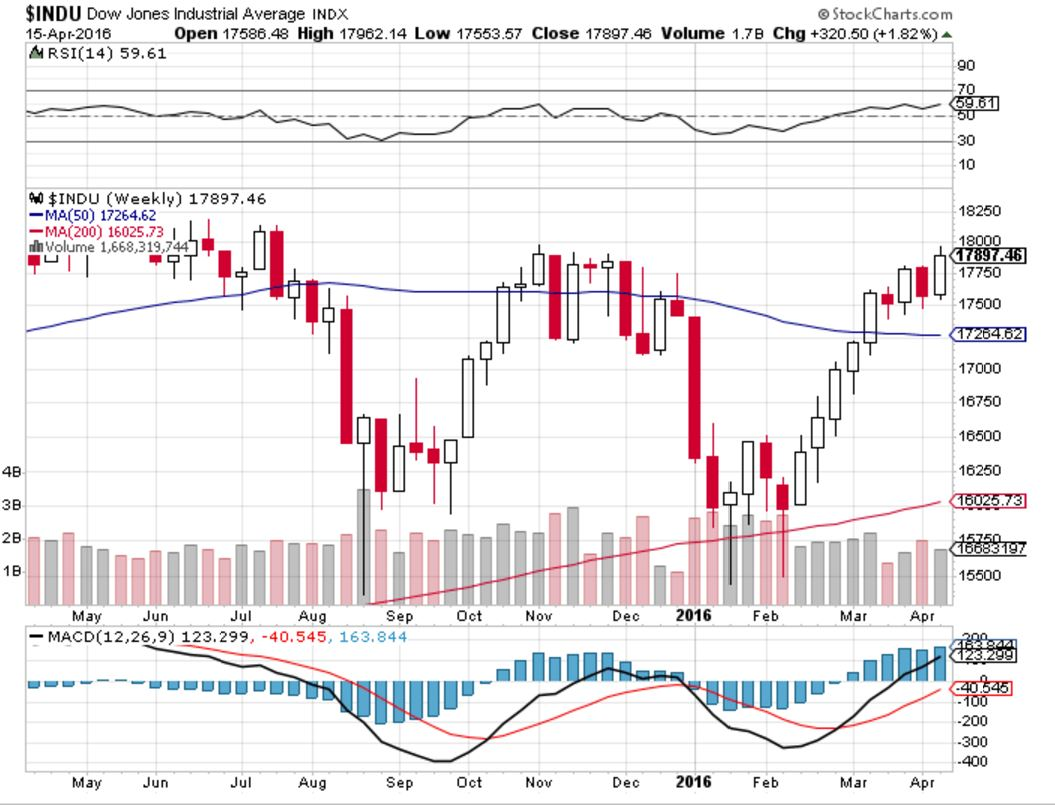
Perform a technical analysis on this stock chart: Identify where to buy, where to sell, support and resistance levels, future chart expectations, RSI, MACD indicator
Perform a technical analysis on this stock chart:
Identify where to buy, where to sell, support and resistance levels, future chart expectations, RSI, MACD indicator interpretation, pattterns of note, etc.
Step by Step Solution
There are 3 Steps involved in it
Step: 1

Get Instant Access to Expert-Tailored Solutions
See step-by-step solutions with expert insights and AI powered tools for academic success
Step: 2

Step: 3
Ace Your Homework with AI
Get the answers you need in no time with our AI-driven, step-by-step assistance
Get Started