Answered step by step
Verified Expert Solution
Question
1 Approved Answer
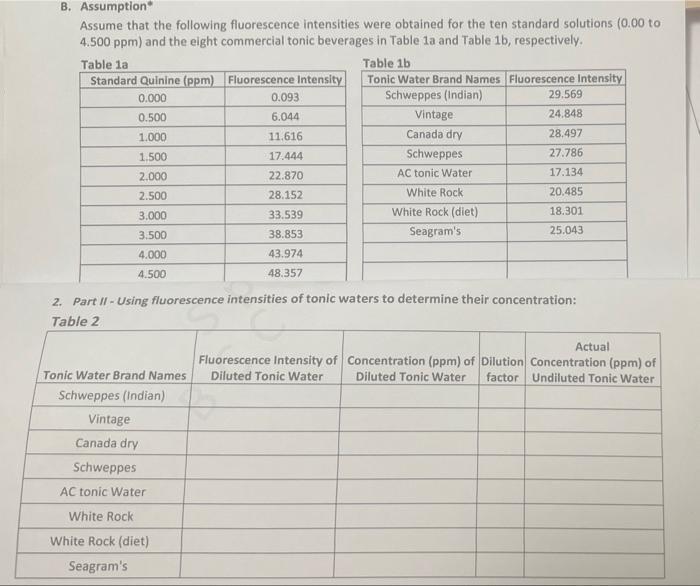
please plug in the figures and complete rhe graph and table 2 Assume that the following fluorescence intensities were obtained for the ten standard solutions
please plug in the figures and complete rhe graph and table 2 


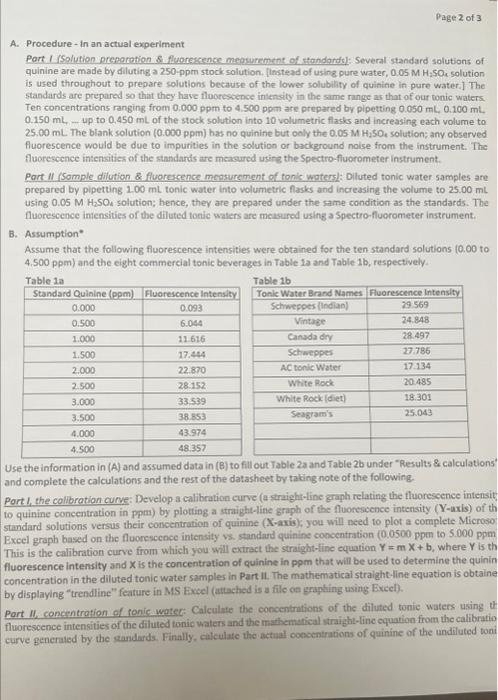
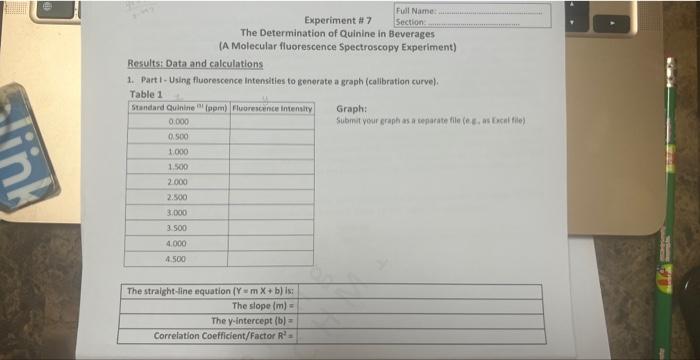
Assume that the following fluorescence intensities were obtained for the ten standard solutions ( 0.00 to 4.500 ppm) and the elght commercial tonic beverages in Table 1a and Table 1b, respectively. 2. Part II - Using fluorescence intensities of tonic waters to determine their concentration: A. Procedure - in an actual experiment Port I (Solution preporotion \& fluoreccence meosurement of standandsl: Several standard solutions of quinine are made by diluting a 250 -ppm stock solution. [instead of using pure water, 0.05MH2SO, solution is used throughout to prepare solutions because of the lower solubility of quinine in pure water.] The standards are prepared so that they have floorescence intensity in the same range as that of our tonic waters. Ten concentrations ranging from 0.000ppm to 4.500ppm are prepared by pipetting 0.050mL,0.100mL 0.150mL, up to 0.450mL of the stock solution into 10 volumetric flasks and increasing each volume to 25.00mL The blank solution ( 0.000ppm ) has no quinine but ooly the 0.05MH2SO4 solution; any obsarved fluorescence would be due to impurities in the solution or background noise from the instrument. The fluorescence intensities of the standards are measured using the Spectro-fluorometer instrument. Part II (Somple dilution \& fluorescense meosurement of tonis waters): Oiluted tonic water samples are prepared by pipetting 1.00mL tonic water into volumetric flasks and increasing the volume to 25.00mL using 0.05MH2SO4 solution; hence, they are prepared under the same condition as the standards. The fluorescence intensities of the diluted tonic waters are measured using a Spectro-fluorometer instrument. B. Assumption" Assume that the following fluorescence intensities were obtained for the ten standard solutions 10.00 to 4.500ppm ) and the eight commercial tonic beverages in Table 1a and Table 1b, respectively. Use the information in (A) and assumed data in (B) to fill out Table 2a and Table 2b under "Results 8 calculations" and complete the calculations and the rest of the datasheet by taking note of the following. Part1, the collbration curve: Develop a calibration curve (a straight-line graph relating the fluorescence intensit) to quinine concentration in pem) by plotting a straight-line graph of the fluonestence interisity (Y-uxis) of th standard solutions versus their concentration of quinine (X-axis); you will need to plot a complete Microso, Exeel graph based on the fluorescence intensity vs. standard quinine concentration (0.0500 ppen to 5.000ppm This is the calibration curve from which you will extract the straight-fine equation Y=mX+b, where Y is th fluorescence intensity and X is the concentration of quinine in ppm that will be used to determine the quinin concentration in the diluted tonic water samples in Part II. The mathematical stralght -line equation is obtaine by displaying "trendline" feature in MS Excel (attached is a file on graphing using Excel). Part 11 , concentration of canie wateg: Caiculate the concentrations of the diluted tonic waters using th fluorescence intensities of the diluted tonic waters and the mathematical straight-line equation from the calibratio Results: Data and calculations 1. Part 1- Using fluorescence intensities to generate a graph (calibration curve). Takia 1 Graph: submit your graph as a tenarate file (e Es as focal file) Assume that the following fluorescence intensities were obtained for the ten standard solutions ( 0.00 to 4.500 ppm) and the elght commercial tonic beverages in Table 1a and Table 1b, respectively. 2. Part II - Using fluorescence intensities of tonic waters to determine their concentration: A. Procedure - in an actual experiment Port I (Solution preporotion \& fluoreccence meosurement of standandsl: Several standard solutions of quinine are made by diluting a 250 -ppm stock solution. [instead of using pure water, 0.05MH2SO, solution is used throughout to prepare solutions because of the lower solubility of quinine in pure water.] The standards are prepared so that they have floorescence intensity in the same range as that of our tonic waters. Ten concentrations ranging from 0.000ppm to 4.500ppm are prepared by pipetting 0.050mL,0.100mL 0.150mL, up to 0.450mL of the stock solution into 10 volumetric flasks and increasing each volume to 25.00mL The blank solution ( 0.000ppm ) has no quinine but ooly the 0.05MH2SO4 solution; any obsarved fluorescence would be due to impurities in the solution or background noise from the instrument. The fluorescence intensities of the standards are measured using the Spectro-fluorometer instrument. Part II (Somple dilution \& fluorescense meosurement of tonis waters): Oiluted tonic water samples are prepared by pipetting 1.00mL tonic water into volumetric flasks and increasing the volume to 25.00mL using 0.05MH2SO4 solution; hence, they are prepared under the same condition as the standards. The fluorescence intensities of the diluted tonic waters are measured using a Spectro-fluorometer instrument. B. Assumption" Assume that the following fluorescence intensities were obtained for the ten standard solutions 10.00 to 4.500ppm ) and the eight commercial tonic beverages in Table 1a and Table 1b, respectively. Use the information in (A) and assumed data in (B) to fill out Table 2a and Table 2b under "Results 8 calculations" and complete the calculations and the rest of the datasheet by taking note of the following. Part1, the collbration curve: Develop a calibration curve (a straight-line graph relating the fluorescence intensit) to quinine concentration in pem) by plotting a straight-line graph of the fluonestence interisity (Y-uxis) of th standard solutions versus their concentration of quinine (X-axis); you will need to plot a complete Microso, Exeel graph based on the fluorescence intensity vs. standard quinine concentration (0.0500 ppen to 5.000ppm This is the calibration curve from which you will extract the straight-fine equation Y=mX+b, where Y is th fluorescence intensity and X is the concentration of quinine in ppm that will be used to determine the quinin concentration in the diluted tonic water samples in Part II. The mathematical stralght -line equation is obtaine by displaying "trendline" feature in MS Excel (attached is a file on graphing using Excel). Part 11 , concentration of canie wateg: Caiculate the concentrations of the diluted tonic waters using th fluorescence intensities of the diluted tonic waters and the mathematical straight-line equation from the calibratio Results: Data and calculations 1. Part 1- Using fluorescence intensities to generate a graph (calibration curve). Takia 1 Graph: submit your graph as a tenarate file (e Es as focal file) 


Step by Step Solution
There are 3 Steps involved in it
Step: 1

Get Instant Access to Expert-Tailored Solutions
See step-by-step solutions with expert insights and AI powered tools for academic success
Step: 2

Step: 3

Ace Your Homework with AI
Get the answers you need in no time with our AI-driven, step-by-step assistance
Get Started


