

Question: Please read the story plot and tables below before answering the my questions at the bottom. Thank you for your help. During mid-September 2015, the
Please read the story plot and tables below before answering the my questions at the bottom. Thank you for your help.
During mid-September 2015, the top managers of the Gale Force Corporation, a leading manufacturer of windsurfing equipment and surfboards, were gathered in the president's conference room reviewing the results of the company's operations during the past fiscal year (which runs from October 1 to September 30). "Not a bad year, on the whole," remarked the president, 32-year-old Charles ("Chuck") Jamison. "Sales were up, profits were up, and our return on equity was a respectable 15 percent. In fact," he continued, "the only dark spot I can find in our whole annual report is the profit margin, which is only 2.25 percent. Seems like we ought to be making more than that, don't you think, Tim?" He looked across the table at the vice president for finance, Timothy Baggit, age 28. "I agree," replied Tim, "and I'm glad you brought it up, because I have a suggestion on how to improve that situation." He leaned forward in his chair as he realized he had captured the interest of the others. "The problem is, we have too many expenses on our income statement that are eating up the profits. Now, I've done some checking, and the expenses all seem to be legitimate except for interest expense. Look here, we paid over $250,000 last year to the bank just to finance our short-term borrowing. If we could have kept that money instead, our profit margin ratio would have been 4.01 percent, which is higher than any other firm in the industry." "But, Tim, we have to borrow like that," responded Roy ("Pop") Thomas, age 35, the vice president for production. "After all, our sales are seasonal, with almost all occurring between March and September. Since we don't have much money coming in from October to February, we have to borrow to keep the production line going." "Right," Tim replied, "and it's the production line that's the problem. We produce the same number of products every month, no matter what we expect sales to be. This causes inventory to build up when sales are slow and to deplete when sales pick up. That fluctuating inventory causes all sorts of problems, including the excessive amount of borrowing we have to do to finance the inventory accumulation." (See Tables 1 through 5 for details of Gale Force's current operations based on equal monthly production.)
Table 1
Sales Forecast (in units) First Quarter Second Quarter Third Quarter Fourth Quarter October 2014.......150 January...................... 0 April ........................ 500 July......................... 1,000 November ........... 75 February.................... 0 May..........................1,000 August..................... 500 December............ 25 March........................300 June..........................1,000 September................ 250
Table 2 Production Schedule and Inventory (equal monthly production) Beginning Inventory Production This Month Sales End Inventory Inventory ($2,000 per unit) October 2014............... 400 + 400 - 150 = 650 $1,300,000 November ................... 650 400 75 975 1,950,000 December.................... 975 400 25 1,350 2,700,000 January........................ 1,350 400 0 1,750 3,500,000 February...................... 1,750 400 0 2,150 4,300,000 March.......................... 2,150 400 300 2,250 4,500,000 April............................ 2,250 400 500 2,150 4,300,000 May............................. 2,150 400 1,000 1,550 3,100,000 June............................. 1,550 400 1,000 950 1,900,000 July.............................. 950 400 1,000 350 700,000 August......................... 350 400 500 250 500,000 September ................... 250 400 250 400 800,000
Table 3 Sales Forecast, Cash Receipts and Payments, and Cash Budget October 2014 November December January February March Sales Forecast Sales (units) ................................ 150 75 25 0 0 300 Sales (unit price: $3,000)............ $ 450,000 $ 225,000 $ 75,000 0 0 $ 900,000 Cash Receipts Schedule 50% cash..................................... $ 225,000 $ 112,500 $ 37,500 $ 450,000 50% from prior month's sales*... $ 375,000 $ 225,000 $ 112,500 $ 37,500 0 0 Total cash receipts ................ $ 600,000 $ 337,500 $ 150,000 $ 37,500 0 $ 450,000 Cash Payments Schedule Production in units...................... 400 400 400 400 400 400 Production costs (each = $2,000) $ 800,000 $ 800,000 $ 800,000 $ 800,000 $ 800,000 $ 800,000 Overhead..................................... $ 200,000 $ 200,000 $ 200,000 $ 200,000 $ 200,000 $ 200,000 Dividends and interest ................ 0 0 0 0 0 0 Taxes .......................................... $ 150,000 0 0 $ 150,000 0 0 Total cash payments.............. $ 1,150,000 $ 1,000,000 $ 1,000,000 $ 1,150,000 $ 1,000,000 $ 1,000,000 Cash Budget; Required Minimum Balance is $125,000 Cash flow.................................... $ -550,000 -662,500 -850,000 -1,112,500 -1,000,000 -550,000 Beginning cash ........................... 125,000 125,000 125,000 125,000 125,000 125,000 Cumulative cash balance............. -425,000 -537,500 -725,000 -987,500 -875,000 -425,000 Monthly loan or (repayment)...... $ 550,000 $ 662,500 $ 850,000 $ 1,112,500 $ 1,000,000 $ 550,000 Cumulative loan.......................... $ 550,000 $ 1,212,500 $ 2,062,500 $ 3,175,000 $ 4,175,000 $ 4,725,000 Ending cash balance.................... $ 125,000 $ 125,000 $ 125,000 $ 125,000 $ 125,000 $ 125,000 *September sales assumed to be $750,000. Gale Force Surfing "Now, here's my idea," said Tim. "Instead of producing 400 items a month, every month, we match the production schedule with the sales forecast. For example, if we expect to sell 150 windsurfers in October, then we only make 150. That way we avoid borrowing to make the 250 more that we don't expect to sell, anyway. Over the course of an entire year the savings in interest expense could really add up." "Hold on, now," Pop responded, feeling that his territory was being threatened. "That kind of scheduling really fouls up things in the shop where it counts. It causes a feast or famine environmentnothing to do for one month, then a deluge the next. It's terrible for the employees, not to mention the supervisors who are trying to run an efficient operation. Your idea may make the income statements look good for now, but the whole company will suffer in the long run." Chuck intervened. "OK, you guys, calm down. Tim may have a good idea or he may not, but at least it's worth looking into. I propose that you all work up two sets of figures, one assuming level production and one matching production with sales. We'll look at them both and see if Tim's idea really does produce better results. If it does, we'll check it further against other issues Pop is concerned about and then make a decision on which alternative is better for the firm."
Table 3 (continued) April May June July August September Sales Forecast Sales (units)................................. 500 1,000 1,000 1,000 500 250 Sales (unit price: $3,000)............. $1,500,000 $3,000,000 $3,000,000 $3,000,000 $1,500,000 $ 750,000 Cash Receipts Schedule 50% cash ..................................... $ 750,000 $1,500,000 $1,500,000 $1,500,000 $ 750,000 $ 375,000 50% from prior month's sales...... $ 450,000 $ 750,000 $1,500,000 $1,500,000 $1,500,000 $ 750,000 Total cash receipts................. $1,200,000 $2,250,000 $3,000,000 $3,000,000 $2,250,000 $ 1,125,000 Cash Payments Schedule Production in units....................... 400 400 400 400 400 400 Production costs (each = $2,000). $ 800,000 $ 800,000 $ 800,000 $ 800,000 $ 800,000 $ 800,000 Overhead ..................................... $ 200,000 $ 200,000 $ 200,000 $ 200,000 $ 200,000 $ 200,000 Dividends and interest ................. 0 0 0 0 $1,000,000 0 Taxes........................................... $ 150,000 0 0 $ 300,000 0 0 Total cash payments .............. $1,150,000 $1,000,000 $1,000,000 $1,300,000 $2,000,000 $1,000,000 Cash Budget; Required Minimum Balance is $125,000 Cash flow..................................... 50,000 1,250,000 2,000,000 1,700,000 250,000 125,000 Beginning cash ............................ 125,000 125,000 125,000 125,000 400,000 650,000 Cumulative cash balance ............. 175,000 1,375,000 2,125,000 1,825,000 650,000 775,000 Monthly loan or (repayment).......... ($ 50,000) ($1,250,000) ($2,000,000) ($1,425,000) 0 0 Cumulative loan........................... $4,675,000 $3,425,000 $1,425,000 0 0 0 Ending cash balance .................... $ 125,000 $ 125,000 $ 125,000 $ 400,000 $ 650,000 $ 775,000
Table 4 Cash Accounts Receivable* Inventory Total Current Case 5 Total Current Assets First Year Assets October............. $125,000 + $225,000 + $1,300,000 = $1,650,000 November......... 125,000 112,500 1,950,000 2,187,500 December.......... 125,000 37,500 2,700,000 2,862,500 January ............. 125,000 0 3,500,000 3,625,000 February ........... 125,000 0 4,300,000 4,425,000 March ............... 125,000 450,000 4,500,000 5,075,000 April ................. 125,000 750,000 4,300,000 5,175,000 May................... 125,000 1,500,000 3,100,000 4,725,000 June................... 125,000 1,500,000 1,900,000 3,525,000 July ................... 400,000 1,500,000 700,000 2,600,000 August .............. 650,000 750,000 500,000 1,900,000 September......... 775,000 375,000 800,000 1,950,000 * Equals 50 percent of monthly sales
Table 5 Cumulative loan balance and interest expense (1% per month) October November December January February March Cumulative loan balance.................... $ 550,000 $1,212,500 $2,062,500 $3,175,000 $4,175,000 $4,725,000 Interest expense at (prime, 8.0%, + 4.0%) 12.00% .......... $ 5,500 $ 12,125 $ 20,625 $ 31,750 $ 41,750 $ 47,250 April May June July August September Cumulative loan balance.................... $4,675,000 $3,425,000 $1,425,000 0 0 0 Interest expense at (prime, 8.0%, + 4.0%) 12.00% .......... $ 46,750 $ 34,250 $ 14,250 0 0 0 Total interest expense for the year: $254,250
Questions I have:
1. Tables 1 through 5 contain the financial information describing the effects of level production on inventory, cash flow, loan balances, and interest expense. How I should recreate these tables in a scenario where Tim's suggestion were implemented; that is, change the Production This Month column in Table 2 from 400 each month to 150, 75, 25, and so on, to match Sales in the next column? How would I recompute the remainder of Table 2, and Tables 3, 4, and 5 based on the new production numbers; if the Beginning inventory is still 400 units, Beginning cash is still $125,000, and that remains the minimum required balance?
2. Given that Gale Force is charged 12 percent annual interest (1 percent a month) on its cumulative loan balance each month (Table 5), how much would Tim's suggestion save in interest expense in a year?
3. Up until now, we have not considered any inefficiencies that have been introduced as a result of going from level to seasonal production. Assume that there is an added expense for each sales dollar of .5 percent (.005). Based on this fact and the information computed in question 2, is seasonal production justified?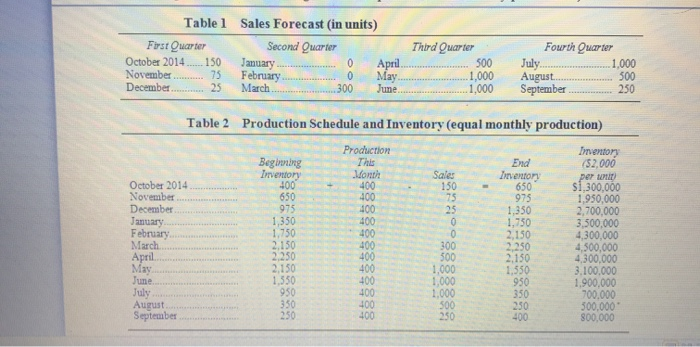
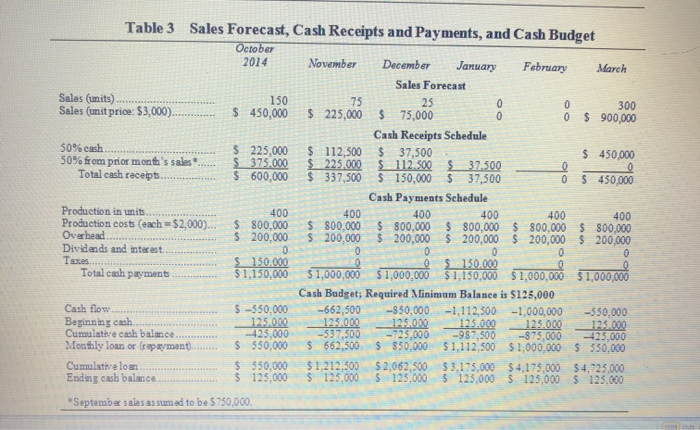
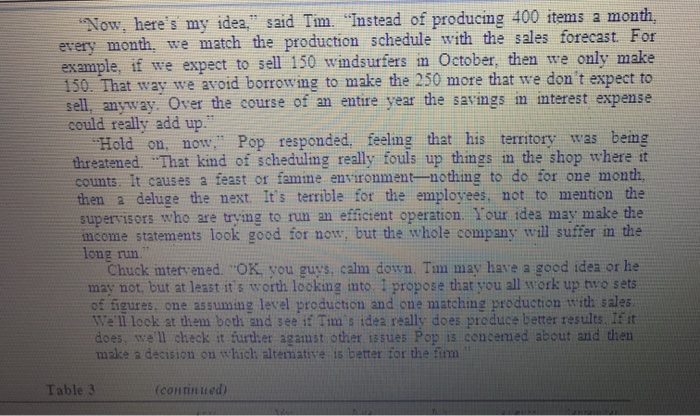
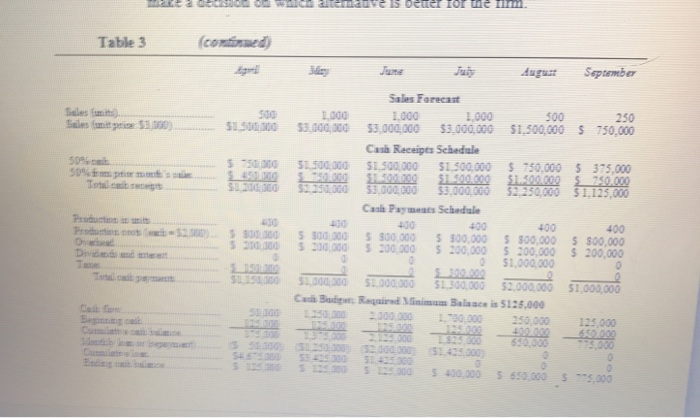
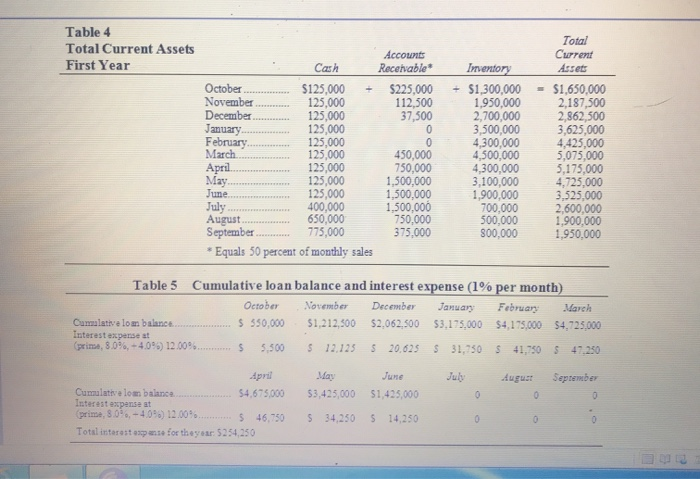
Table 1 First Quarter October 2014 150 November 75 December 25 Sales Forecast (in units) Second Quarter January 0 April February 0 March .300 Third Quarter 500 1,000 1.000 Fourth Quarter July 1,000 August 300 September 250 May June Table 2 Production Schedule and Inventory (equal monthly production) Production Inventory Beginning This End (52.000 Inventory Mont Sales Inventory per October 2014 400 400 150 650 Si 300,000 November 650 400 75 975 1,950,000 December 975 100 25 1,350 2,700,000 January 1,350 400 1.750 3,500,000 February 1.750 400 0 2,150 4,300,000 March 2.150 400 300 2.250 4,500,000 April. 2.250 400 500 2.150 4.300,000 May 2.150 400 1,000 1.550 3.100.000 1.350 400 1,000 950 1.900,000 July 950 400 1.000 350 700.000 August 350 400 500 250 300,000 September 250 400 250 400 800.000 June Table 3 Sales Forecast, Cash Receipts and Payments, and Cash Budget October 2014 November December January February March Sales Forecast Sales (units) 150 75 25 0 0 300 Sales (unit price: $3,000) $ 450,000 $ 225,000 $ 75,000 0 0 $ 900,000 Cash Receipts Schedule 50% cash $225,000 $ 112,500 $ 37,500 $ 450,000 50% from prior month's sales $_375.000 $225.000 $ 112.500 5 37.500 0 Total cash receipts. $ 600,000 $ 337,500 $ 150,000 $37,500 0 $ 450.000 Cash Payments Schedule Production in units 400 400 400 400 400 400 Production costs (each = $2,000)... $ 800,000 $ 800.000 $ 800,000 $ 800,000 $ 800,000 $ 800,000 Overhead $ 200.000 $ 200,000 $ 200,000 $ 200.000 $ 200,000 $200,000 Dividends and interest 0 0 0 0 0 0 Taxes. 150.000 $ Total cash payments $1,150,000 $1,000,000 Cash Budget; Required Minimum Balance is $125,000 Cash flow $-350.000 -662,500 -850,000 -1,112,500 -1,000,000 -350,000 Beginning cash 125.000 125.000 125.000 125.000 125.000 125.000 Cumulative cash balace -425,000 -537,500 -725,000 -987.500 -875,000 -425.000 Monthly loan or (repayment). $ 550,000 $662,500 $ 850,000 $1,112,500 $1,000,000 $350,000 Cumulative loan $ 550.000 $1.212.500 $ 2,062,500 $3.175,000 $4,175,000 $4,725,000 Ending cash balance $ 125.000 $ 125,000 $125.000 $ 125,000 $ 125,000 $ 125.000 September sales assumed to be $750,000, $1,000,000 $1,150,000 $1,000,008 $1,000,000 "Now, here's my idea," said Tim. "Instead of producing 400 items a month. every month we match the production schedule with the sales forecast. For example, if we expect to sell 150 windsurfers in October, then we only make 150. That way we avoid borrowing to make the 250 more that we don't expect to sell, anyway. Over the course of an entire year the savings in interest expense could really add up. "Hold on. now," Pop responded feeling that his territory was being threatened. "That kind of scheduling really fouls up things in the shop where it counts. It causes a feast or famine environment-nothing to do for one month, then a deluge the next. It's terrible for the employees, not to mention the supervisors who are trying to run an efficient operation. Your idea may make the income statements look good for now, but the whole company will suffer in the long run Chuck intervened. "OK, you guys, calm down. Tim may have a good idea or he may not, but at least it's worth looking into. I propose that you all work up two sets of figures, one assuming level production and one matching production with sales We'll lock at them both and see if Tim's idea really does produce better results. If it does, we'll check it further against other issues Pop is concemed about and then make a decision on which alternative is better for the fimm Table 3 (continued) de des Deuter Or we na Table 3 (continued) September 500 Sales (mit prise 55,000 SILS 50% rimos 550 SL.000 Sale Forecast 1.000 1.000 1.000 500 250 53,000,000 $3.000.000 $3,000,000 $1,500,000 $750,000 Cash Receipts Schedule ST300000 SI 500.000 $1.500.000 $750,000 $375,000 2010 5.000 $1.500.000 $1.500.000 250.000 30.000 $3.000.000 $3.000.000 52.250.000 $ 1.125.000 Cal Payments Schedule 400 400 400 400 5 100.000 $300 000 $300.000 5 900.000 $ 900.000 500 $300.000 $ 200.000 $ 200.000 $ 200.000 $1.000.000 0 SH300.00 SL300.000 SL300.000 $2.000.000 $1.000.000 Cu aquad Minimum Balance is $125.000 2.000.000 00000 250.000 125.000 53 Die SS Begini 650.000 000 S SS 0000 SED Se 59000 50.000 5550.000 3 000 Table 4 Total Current Assets First Year - - Accounts Cash Receivable October $125,000 $225,000 November 125,000 112,500 December 125,000 37,500 January 125,000 0 February 125,000 0 March 125,000 450,000 April 125,000 750,000 May 125,000 1,500,000 June 125,000 1,500,000 July 400,000 1,500,000 August 650,000 750,000 September 775,000 375,000 * Equals 50 percent of monthly sales Inventory $1,300,000 1,950,000 2,700,000 3,500,000 4,300,000 4,500,000 4,300,000 3,100,000 1,900,000 700,000 500,000 800,000 Total Current Assets = $1,650,000 2,187,500 2,862,500 3,625,000 4,425,000 5,075,000 5,175,000 4,725,000 3.525,000 2,600,000 1,900,000 1,950,000 Table 5 Cumulative loan balance and interest expense (1% per month) October November December January February March Cumulative lom balance $ 350,000 $1,212,500 $2.062.500 53.175,000 $4,175,000 $4,725,000 Interest expenses (prima, 8.0%, +4,0%) 12.00%............ 5 5.500 $ 12.123 $ 20,625 $ 31,730 $ 41,750 5 47.250 June July May $3,425,000 August 0 September 0 $1,425,000 0 April Cumulativelom balanca 54.675.000 Interest expense at prima, 8.0, -40) 12.00%............ $ 46.750 Total interest expuse for the year: 5254,250 S 34.250 S 14.250 0 Table 1 First Quarter October 2014 150 November 75 December 25 Sales Forecast (in units) Second Quarter January 0 April February 0 March .300 Third Quarter 500 1,000 1.000 Fourth Quarter July 1,000 August 300 September 250 May June Table 2 Production Schedule and Inventory (equal monthly production) Production Inventory Beginning This End (52.000 Inventory Mont Sales Inventory per October 2014 400 400 150 650 Si 300,000 November 650 400 75 975 1,950,000 December 975 100 25 1,350 2,700,000 January 1,350 400 1.750 3,500,000 February 1.750 400 0 2,150 4,300,000 March 2.150 400 300 2.250 4,500,000 April. 2.250 400 500 2.150 4.300,000 May 2.150 400 1,000 1.550 3.100.000 1.350 400 1,000 950 1.900,000 July 950 400 1.000 350 700.000 August 350 400 500 250 300,000 September 250 400 250 400 800.000 June Table 3 Sales Forecast, Cash Receipts and Payments, and Cash Budget October 2014 November December January February March Sales Forecast Sales (units) 150 75 25 0 0 300 Sales (unit price: $3,000) $ 450,000 $ 225,000 $ 75,000 0 0 $ 900,000 Cash Receipts Schedule 50% cash $225,000 $ 112,500 $ 37,500 $ 450,000 50% from prior month's sales $_375.000 $225.000 $ 112.500 5 37.500 0 Total cash receipts. $ 600,000 $ 337,500 $ 150,000 $37,500 0 $ 450.000 Cash Payments Schedule Production in units 400 400 400 400 400 400 Production costs (each = $2,000)... $ 800,000 $ 800.000 $ 800,000 $ 800,000 $ 800,000 $ 800,000 Overhead $ 200.000 $ 200,000 $ 200,000 $ 200.000 $ 200,000 $200,000 Dividends and interest 0 0 0 0 0 0 Taxes. 150.000 $ Total cash payments $1,150,000 $1,000,000 Cash Budget; Required Minimum Balance is $125,000 Cash flow $-350.000 -662,500 -850,000 -1,112,500 -1,000,000 -350,000 Beginning cash 125.000 125.000 125.000 125.000 125.000 125.000 Cumulative cash balace -425,000 -537,500 -725,000 -987.500 -875,000 -425.000 Monthly loan or (repayment). $ 550,000 $662,500 $ 850,000 $1,112,500 $1,000,000 $350,000 Cumulative loan $ 550.000 $1.212.500 $ 2,062,500 $3.175,000 $4,175,000 $4,725,000 Ending cash balance $ 125.000 $ 125,000 $125.000 $ 125,000 $ 125,000 $ 125.000 September sales assumed to be $750,000, $1,000,000 $1,150,000 $1,000,008 $1,000,000 "Now, here's my idea," said Tim. "Instead of producing 400 items a month. every month we match the production schedule with the sales forecast. For example, if we expect to sell 150 windsurfers in October, then we only make 150. That way we avoid borrowing to make the 250 more that we don't expect to sell, anyway. Over the course of an entire year the savings in interest expense could really add up. "Hold on. now," Pop responded feeling that his territory was being threatened. "That kind of scheduling really fouls up things in the shop where it counts. It causes a feast or famine environment-nothing to do for one month, then a deluge the next. It's terrible for the employees, not to mention the supervisors who are trying to run an efficient operation. Your idea may make the income statements look good for now, but the whole company will suffer in the long run Chuck intervened. "OK, you guys, calm down. Tim may have a good idea or he may not, but at least it's worth looking into. I propose that you all work up two sets of figures, one assuming level production and one matching production with sales We'll lock at them both and see if Tim's idea really does produce better results. If it does, we'll check it further against other issues Pop is concemed about and then make a decision on which alternative is better for the fimm Table 3 (continued) de des Deuter Or we na Table 3 (continued) September 500 Sales (mit prise 55,000 SILS 50% rimos 550 SL.000 Sale Forecast 1.000 1.000 1.000 500 250 53,000,000 $3.000.000 $3,000,000 $1,500,000 $750,000 Cash Receipts Schedule ST300000 SI 500.000 $1.500.000 $750,000 $375,000 2010 5.000 $1.500.000 $1.500.000 250.000 30.000 $3.000.000 $3.000.000 52.250.000 $ 1.125.000 Cal Payments Schedule 400 400 400 400 5 100.000 $300 000 $300.000 5 900.000 $ 900.000 500 $300.000 $ 200.000 $ 200.000 $ 200.000 $1.000.000 0 SH300.00 SL300.000 SL300.000 $2.000.000 $1.000.000 Cu aquad Minimum Balance is $125.000 2.000.000 00000 250.000 125.000 53 Die SS Begini 650.000 000 S SS 0000 SED Se 59000 50.000 5550.000 3 000 Table 4 Total Current Assets First Year - - Accounts Cash Receivable October $125,000 $225,000 November 125,000 112,500 December 125,000 37,500 January 125,000 0 February 125,000 0 March 125,000 450,000 April 125,000 750,000 May 125,000 1,500,000 June 125,000 1,500,000 July 400,000 1,500,000 August 650,000 750,000 September 775,000 375,000 * Equals 50 percent of monthly sales Inventory $1,300,000 1,950,000 2,700,000 3,500,000 4,300,000 4,500,000 4,300,000 3,100,000 1,900,000 700,000 500,000 800,000 Total Current Assets = $1,650,000 2,187,500 2,862,500 3,625,000 4,425,000 5,075,000 5,175,000 4,725,000 3.525,000 2,600,000 1,900,000 1,950,000 Table 5 Cumulative loan balance and interest expense (1% per month) October November December January February March Cumulative lom balance $ 350,000 $1,212,500 $2.062.500 53.175,000 $4,175,000 $4,725,000 Interest expenses (prima, 8.0%, +4,0%) 12.00%............ 5 5.500 $ 12.123 $ 20,625 $ 31,730 $ 41,750 5 47.250 June July May $3,425,000 August 0 September 0 $1,425,000 0 April Cumulativelom balanca 54.675.000 Interest expense at prima, 8.0, -40) 12.00%............ $ 46.750 Total interest expuse for the year: 5254,250 S 34.250 S 14.250 0
Step by Step Solution
There are 3 Steps involved in it

Get step-by-step solutions from verified subject matter experts