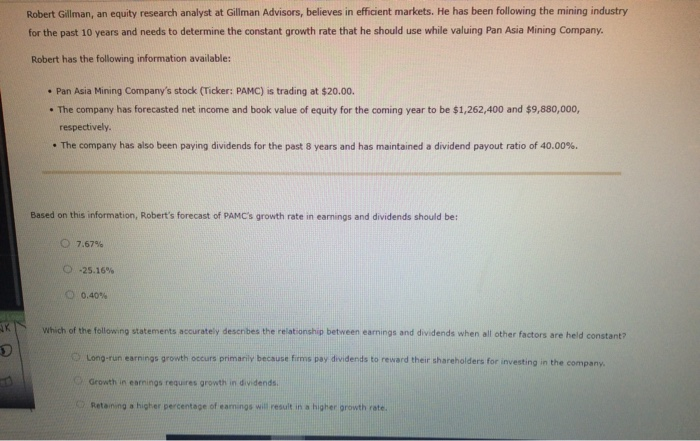
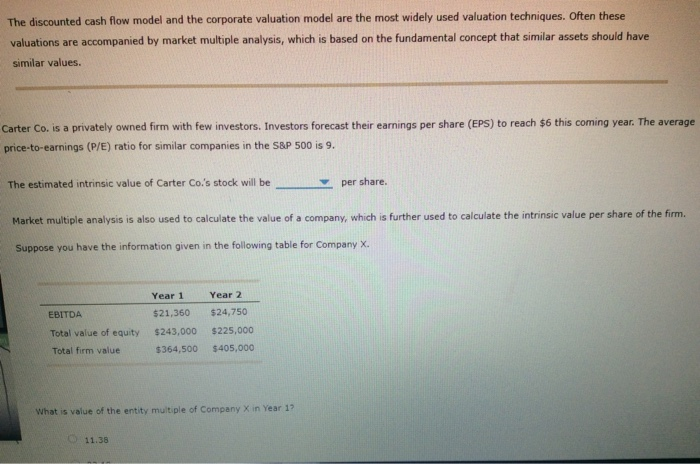
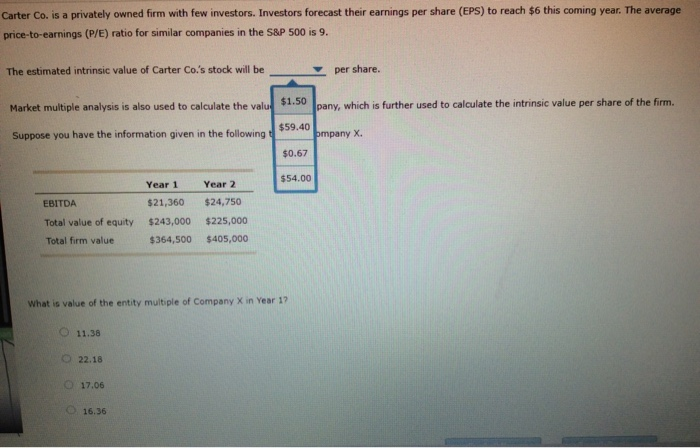
Robert Gillman, an equity research analyst at Gillman Advisors, believes in efficient markets. He has been following the mining industry for the past 10 years and needs to determine the constant growth rate that he should use while valuing Pan Asia Mining Company. Robert has the following information available: Pan Asia Mining Company's stock (Ticker: PAMC) is trading at $20.00. The company has forecasted net income and book value of equity for the coming year to be $1,262,400 and $9,880,000, respectively. The company has also been paying dividends for the past 8 years and has maintained a dividend payout ratio of 40.00%. Based on this information, Robert's forecast of PAMC's growth rate in earnings and dividends should be: 7.67% O -25.16% O 0.40% Which of the following statements accurately describes the relationship between earnings and dividends when all other factors are held constant? Long-run earnings growth occurs primarily because firms pay dividends to reward their shareholders for investing in the company Growth in earnings requires growth in dividends. Retaining a higher percentage of earnings will result in a higher growth rate. The discounted cash flow model and the corporate valuation model are the most widely used valuation techniques. Often these valuations are accompanied by market multiple analysis, which is based on the fundamental concept that similar assets should have similar values. Carter Co. is a privately owned firm with few investors. Investors forecast their earnings per share (EPS) to reach $6 this coming year. The average price-to-earnings (P/E) ratio for similar companies in the S&P 500 is 9. The estimated intrinsic value of Carter Co.'s stock will be per share. Market multiple analysis is also used to calculate the value of a company, which is further used to calculate the intrinsic value per share of the firm. Suppose you have the information given in the following table for Company X. EBITDA Total value of equity Total firm value Year 1 $21,360 $243,000 $364,500 Year 2 $24,750 $225,000 $405,000 What is value of the entity multiple of Company Xin Year 1? 11.38 Carter Co. is a privately owned firm with few investors. Investors forecast their earnings per share (EPS) to reach $6 this coming year. The average price-to-earnings (P/E) ratio for similar companies in the S&P 500 is 9. The estimated intrinsic value of Carter Co.'s stock will be per share. Market multiple analysis is also used to calculate the valu pany, which is further used to calculate the intrinsic value per share of the firm. Suppose you have the information given in the following $59.40 pmpany X. $0.67 $54.00 EBITDA Total value of equity Total firm value Year 1 $21,360 $243,000 $364,500 Year 2 $24,750 $225,000 $405,000 What is value of the entity multiple of Company Xin Year 17 O 11.38 22.18 17.06 O 16.36


