Sensitivity tables
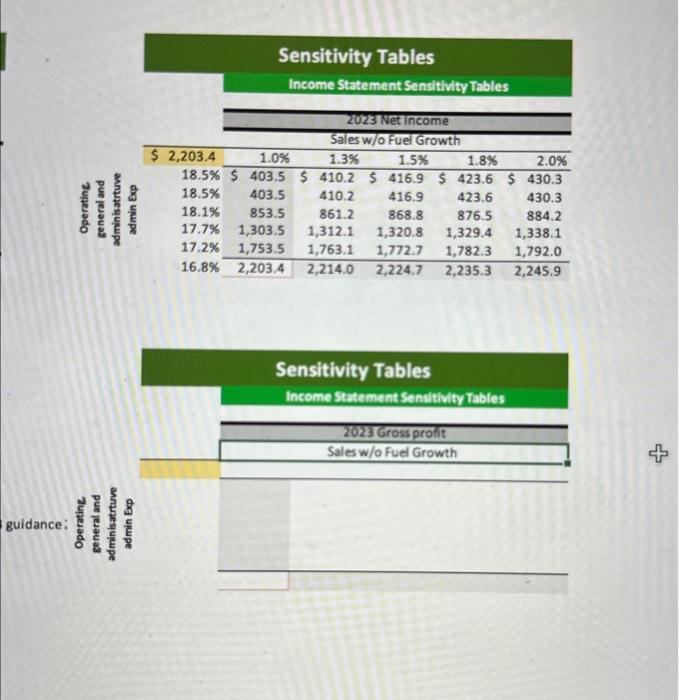
please make 2 more tables like the one shown in the first picture of the 2023 net income table
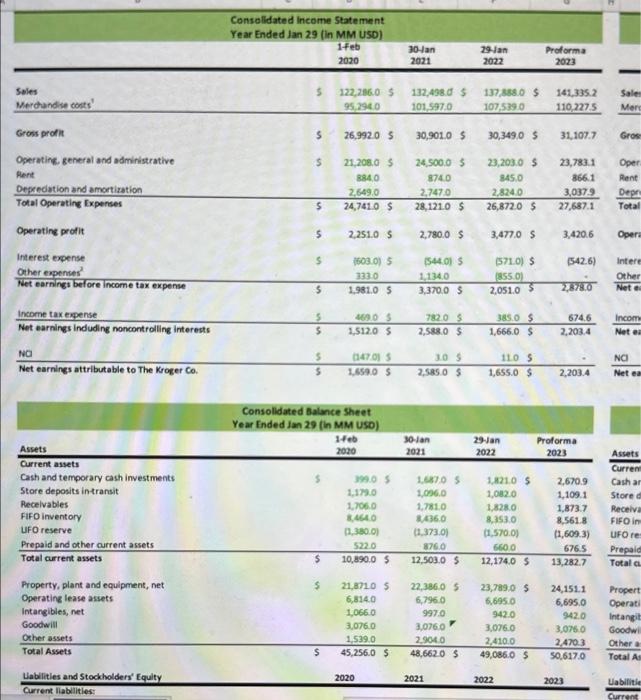
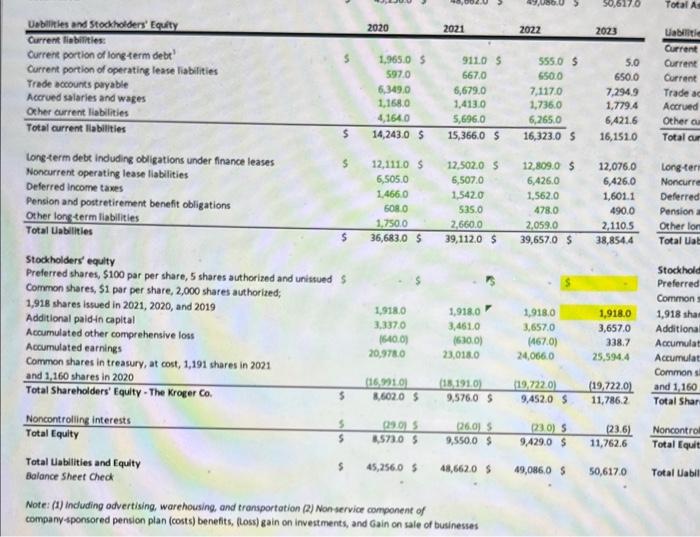
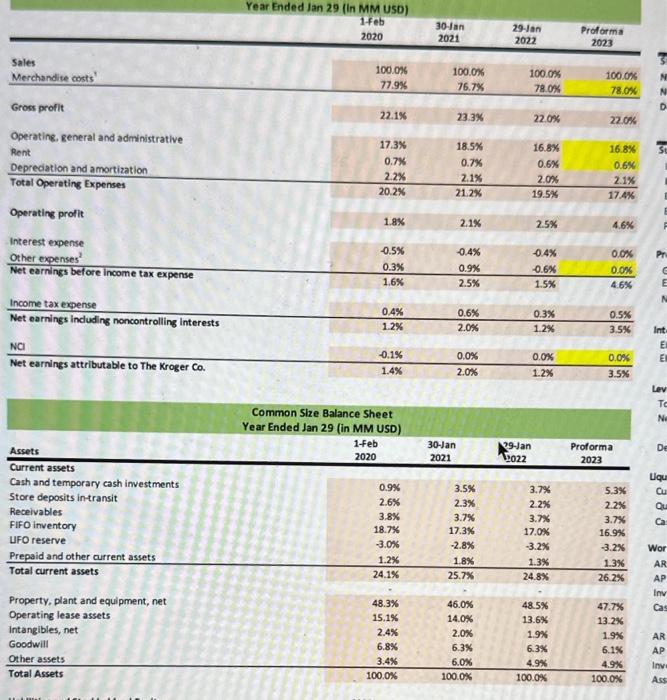
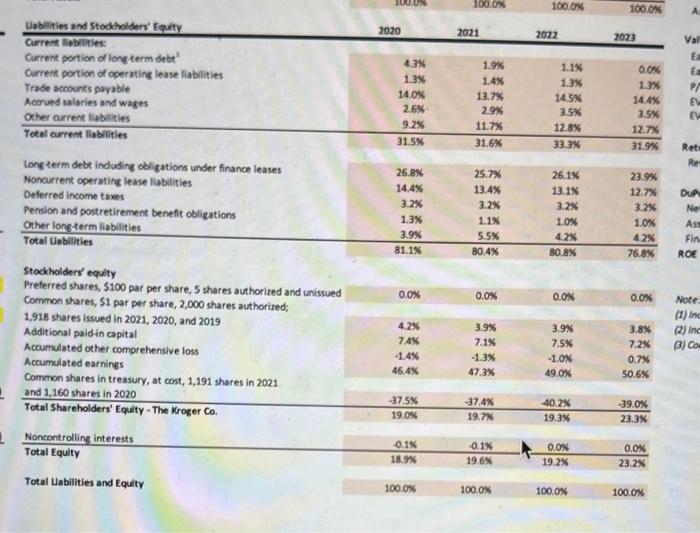
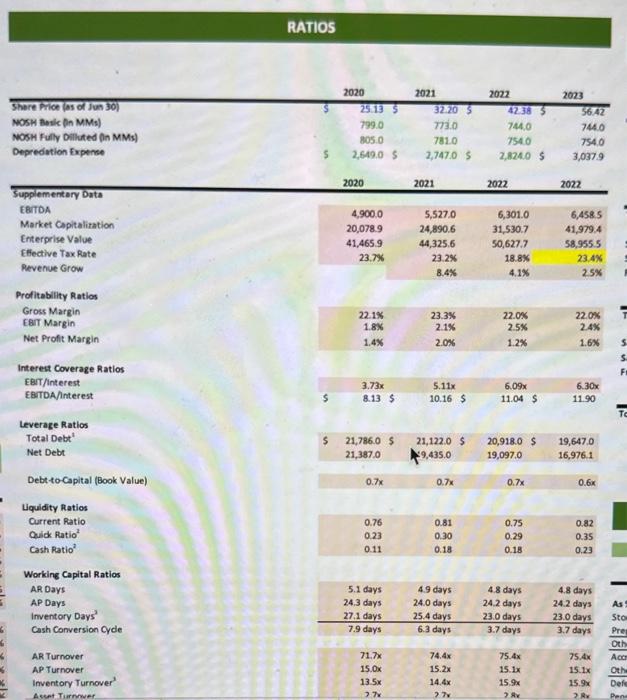
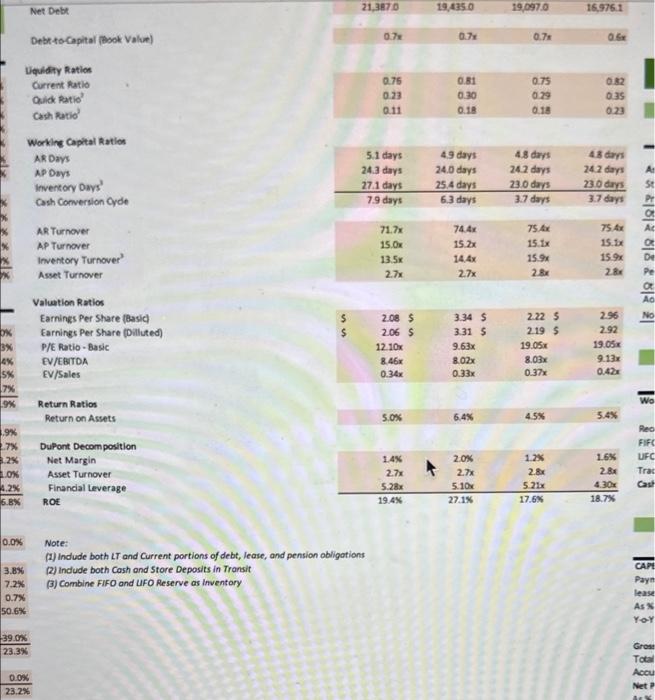
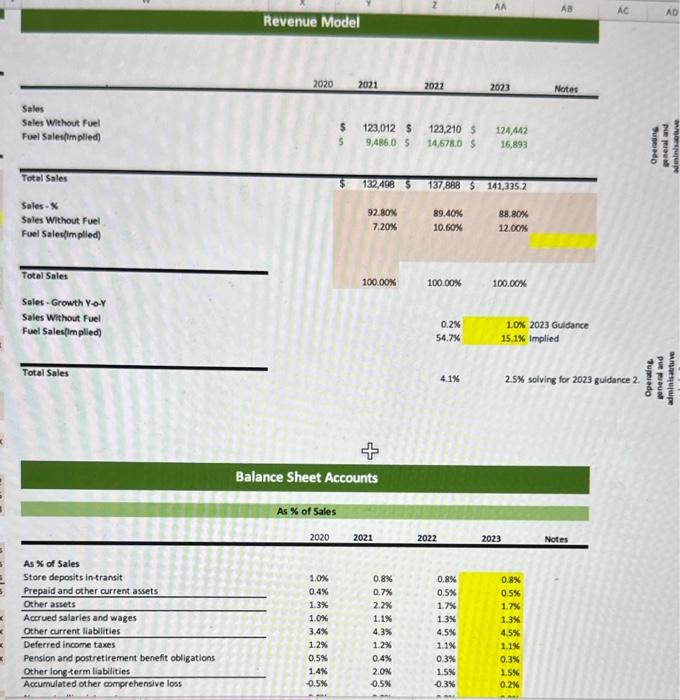
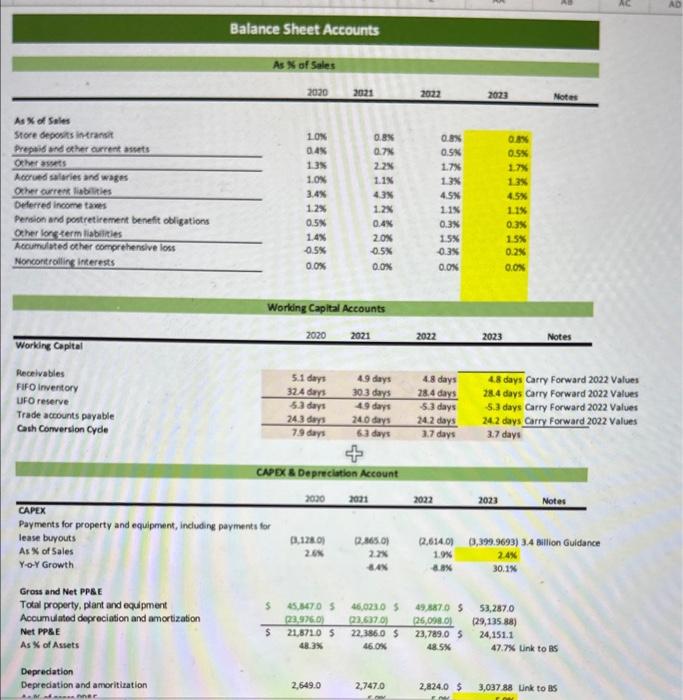
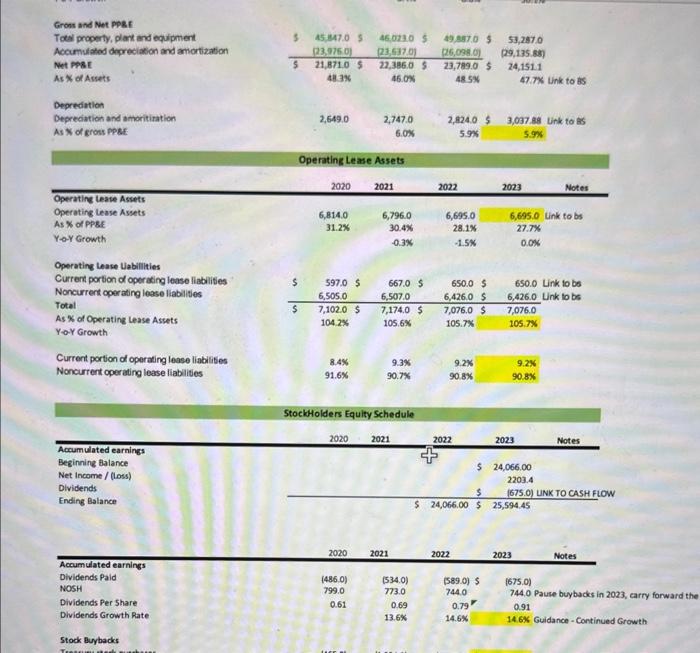
Ueblintes and Stockholders' Equity Current liabilitles: Current portion of loneterm debt" Current portion of operating lease liabilities Trade accounts payable Accrued salaries and wages Orher current liabilities Total aurrent liabilities Long-term debt induding obligations under finance leases Noncurrent operating lease liabilities Deferred income tames Pension and postretirement benefit obligations Other longterm liabilities Total Labilities Stockholders' equily Preferred shares, $100 par per share, 5 shares authorized and unistued 5 Common shares, 51 par per share, 2,000 shares authorized; 1,918 shares issued in 2021, 2020, and 2019 Additional paid-in capital Accumulated other comprehensive loss Accumulated earnings Common shares in treasury, at cost, 1,191 shares in 2021 Noncontroliing interests Total Equity Total Uabilities and Equity Balance Sheet Cheok Note: (1) induding advertising, warehousing, and transportation (2) Nanservice component of company sponsored pension plan (costs) benefits, (Loss) gain on investments, and Gain on sale of businesses Year Ended Jan 29 (In MM USD) Income tax expense \begin{tabular}{llllll} \hline Net earnings including noncontrolling interests & 0.4% & 0.6% & 0.3% & 0.5% \\ \hline \end{tabular} Common Size Balance Sheet Year Ended Jan 29 (in MM USD) Stockholders' equity Prelerred shares, $100 par per share, 5 shares authorized and unissued Common shares, $1 par per share, 2,000 shares authorized; 1,918 shares iswued in 2021, 2020, and 2019 Additional paidin capital Accurnulated other comprehensive loss Accumulated earnings Common shares in treasury, at cost, 1,191 shares in 2021 Noncontrolling interests Total Equlty Total Uabilities and Equity RATIOS Profitability Ratios Gross Margin EBIT Margin Net Proft Margin Interent Coverage Ratios EET//interest E8TDA/interest Leverage Ratios Total Debt" Net Debt Debt-to-Capital (Book Value) Lquidity Ratios Current Ratio Quidk Ratio 2 Cash Ratio 2 Working Capital Ratios AR Days AP Days Inventory Days Cash Conversion Cyde AR Turnover AP Turnover Inventory Turnover' Note: (1) indude both LT and Current portions of debt, lease, and pension obligotions (2) Indude both Cosh and Store Deposits in Transit (3) Combine FIFO and UFO Reserve as inventory Revenue Model \begin{tabular}{lllll} \hline Total Sales 100.00% \end{tabular} Sales-Growth Y-oY Sales Without Fuel Fuel Sales(implied) 0.2%54.761.0K2023Guldance15.16implied Total Sales 4.1\% 2.5% solving for 2023 guidance 2. Balance Sheet Accounts As % of Sales Notes Balance Sheet Accounts As of ofales Working Copital 2020202120222023 Receivables FIFO inventory LFO reserve Trade acrounts payable Cash Comersion Cyde \begin{tabular}{rrrr} 5.1 days & 4.9 days & 4.8 days & 4.8 days Carry Forward 2022 Values \\ 32.4 dars & 30.3 days & 28.4 days & 28.4 days Carry Forward 2022 Values \\ 5.3 days & 4.9 days & 5.3 days & 5.3 days Carry Forward 2022 Values \\ 24.3 dars & 240 days & 24.2 days & 24.2 days Carry Forward 2022 Values \\ \hline 7.9 days & 6.3 days & 3.7 days & 3.7 days \end{tabular} CASX \& Depreciation Account CAPEx Payments for property and equipment, induding payments for lease buyouts As is of Sales Y-o-Y Growth Gross and Net PPEE Total property, plant and equipment Acoumulated deprociation and amortization Net PPEE As % of Assets As 4 of Asiets Deprediation Deprediation and amoritization Grons and Net pper. Toeal property, plant and equipment Accumulatod decreciation and amortization Net Ppse As % of Assets Deprediation Deprediation and amoritiration As % of cross ppet. Operating Lease Uabilities Current portion of operaxing lease lisblities Noncurrent cperating lease liablities Total As % of Operatine Lease Assets Yo.Y Growth Current portion of operating lease liabilises Noncurrent operating lease liablities 8.4%91.6%9.3%90.7%9.2%90.8%9.2%90.8% Stock Buybacks Ueblintes and Stockholders' Equity Current liabilitles: Current portion of loneterm debt" Current portion of operating lease liabilities Trade accounts payable Accrued salaries and wages Orher current liabilities Total aurrent liabilities Long-term debt induding obligations under finance leases Noncurrent operating lease liabilities Deferred income tames Pension and postretirement benefit obligations Other longterm liabilities Total Labilities Stockholders' equily Preferred shares, $100 par per share, 5 shares authorized and unistued 5 Common shares, 51 par per share, 2,000 shares authorized; 1,918 shares issued in 2021, 2020, and 2019 Additional paid-in capital Accumulated other comprehensive loss Accumulated earnings Common shares in treasury, at cost, 1,191 shares in 2021 Noncontroliing interests Total Equity Total Uabilities and Equity Balance Sheet Cheok Note: (1) induding advertising, warehousing, and transportation (2) Nanservice component of company sponsored pension plan (costs) benefits, (Loss) gain on investments, and Gain on sale of businesses Year Ended Jan 29 (In MM USD) Income tax expense \begin{tabular}{llllll} \hline Net earnings including noncontrolling interests & 0.4% & 0.6% & 0.3% & 0.5% \\ \hline \end{tabular} Common Size Balance Sheet Year Ended Jan 29 (in MM USD) Stockholders' equity Prelerred shares, $100 par per share, 5 shares authorized and unissued Common shares, $1 par per share, 2,000 shares authorized; 1,918 shares iswued in 2021, 2020, and 2019 Additional paidin capital Accurnulated other comprehensive loss Accumulated earnings Common shares in treasury, at cost, 1,191 shares in 2021 Noncontrolling interests Total Equlty Total Uabilities and Equity RATIOS Profitability Ratios Gross Margin EBIT Margin Net Proft Margin Interent Coverage Ratios EET//interest E8TDA/interest Leverage Ratios Total Debt" Net Debt Debt-to-Capital (Book Value) Lquidity Ratios Current Ratio Quidk Ratio 2 Cash Ratio 2 Working Capital Ratios AR Days AP Days Inventory Days Cash Conversion Cyde AR Turnover AP Turnover Inventory Turnover' Note: (1) indude both LT and Current portions of debt, lease, and pension obligotions (2) Indude both Cosh and Store Deposits in Transit (3) Combine FIFO and UFO Reserve as inventory Revenue Model \begin{tabular}{lllll} \hline Total Sales 100.00% \end{tabular} Sales-Growth Y-oY Sales Without Fuel Fuel Sales(implied) 0.2%54.761.0K2023Guldance15.16implied Total Sales 4.1\% 2.5% solving for 2023 guidance 2. Balance Sheet Accounts As % of Sales Notes Balance Sheet Accounts As of ofales Working Copital 2020202120222023 Receivables FIFO inventory LFO reserve Trade acrounts payable Cash Comersion Cyde \begin{tabular}{rrrr} 5.1 days & 4.9 days & 4.8 days & 4.8 days Carry Forward 2022 Values \\ 32.4 dars & 30.3 days & 28.4 days & 28.4 days Carry Forward 2022 Values \\ 5.3 days & 4.9 days & 5.3 days & 5.3 days Carry Forward 2022 Values \\ 24.3 dars & 240 days & 24.2 days & 24.2 days Carry Forward 2022 Values \\ \hline 7.9 days & 6.3 days & 3.7 days & 3.7 days \end{tabular} CASX \& Depreciation Account CAPEx Payments for property and equipment, induding payments for lease buyouts As is of Sales Y-o-Y Growth Gross and Net PPEE Total property, plant and equipment Acoumulated deprociation and amortization Net PPEE As % of Assets As 4 of Asiets Deprediation Deprediation and amoritization Grons and Net pper. Toeal property, plant and equipment Accumulatod decreciation and amortization Net Ppse As % of Assets Deprediation Deprediation and amoritiration As % of cross ppet. Operating Lease Uabilities Current portion of operaxing lease lisblities Noncurrent cperating lease liablities Total As % of Operatine Lease Assets Yo.Y Growth Current portion of operating lease liabilises Noncurrent operating lease liablities 8.4%91.6%9.3%90.7%9.2%90.8%9.2%90.8% Stock Buybacks
