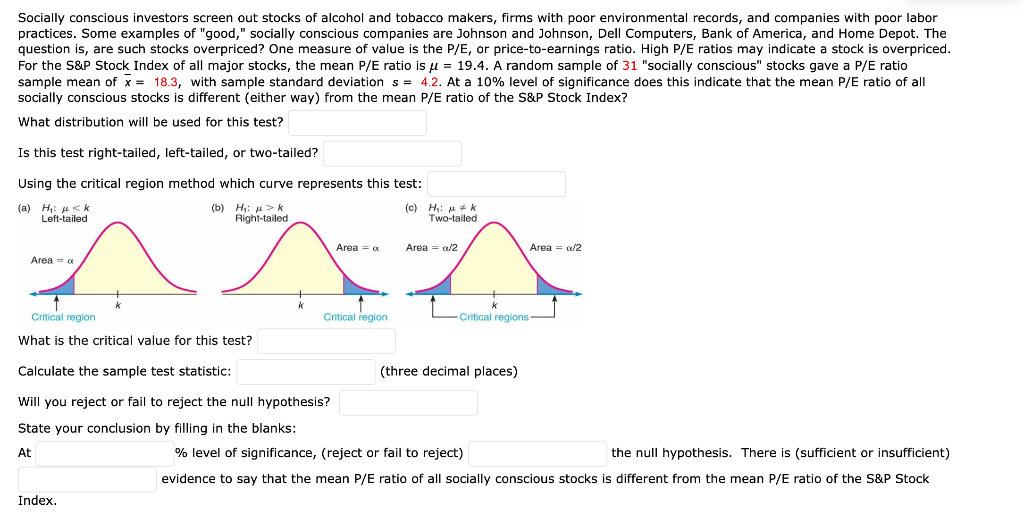
Socially conscious investors screen out stocks of alcohol and tobacco makers, firms with poor environmental records, and companies with poor labor practices. Some examples of "good," socially conscious companies are Johnson and Johnson, Dell Computers, Bank of America, and Home Depot. The question is, are such stocks overpriced? One measure of value is the P/E, or price-to-earnings ratio. High P/E ratios may indicate a stock is overpriced. For the S\&P Stock Index of all major stocks, the mean P/E ratio is =19.4. A random sample of 31 "socially conscious" stocks gave a P/E ratio sample mean of x=18.3, with sample standard deviation s=4.2. At a 10% level of significance does this indicate that the mean P/E ratio of all socially conscious stocks is different (either way) from the mean P/E ratio of the S\&P Stock Index? What distribution will be used for this test? Is this test right-tailed, left-tailed, or two-tailed? Using the critical region method which curve represents this test: What is the critical value for this test? Calculate the sample test statistic: (three decimal places) Will you reject or fail to reject the null hypothesis? State your conclusion by filling in the blanks: At % level of significance, (reject or fail to reject) the null hypothesis. There is (sufficient or insufficient) evidence to say that the mean P/E ratio of all socially conscious stocks is different from the mean P/E ratio of the S\&P Stock Index. Socially conscious investors screen out stocks of alcohol and tobacco makers, firms with poor environmental records, and companies with poor labor practices. Some examples of "good," socially conscious companies are Johnson and Johnson, Dell Computers, Bank of America, and Home Depot. The question is, are such stocks overpriced? One measure of value is the P/E, or price-to-earnings ratio. High P/E ratios may indicate a stock is overpriced. For the S\&P Stock Index of all major stocks, the mean P/E ratio is =19.4. A random sample of 31 "socially conscious" stocks gave a P/E ratio sample mean of x=18.3, with sample standard deviation s=4.2. At a 10% level of significance does this indicate that the mean P/E ratio of all socially conscious stocks is different (either way) from the mean P/E ratio of the S\&P Stock Index? What distribution will be used for this test? Is this test right-tailed, left-tailed, or two-tailed? Using the critical region method which curve represents this test: What is the critical value for this test? Calculate the sample test statistic: (three decimal places) Will you reject or fail to reject the null hypothesis? State your conclusion by filling in the blanks: At % level of significance, (reject or fail to reject) the null hypothesis. There is (sufficient or insufficient) evidence to say that the mean P/E ratio of all socially conscious stocks is different from the mean P/E ratio of the S\&P Stock Index


