

Answered step by step
Verified Expert Solution
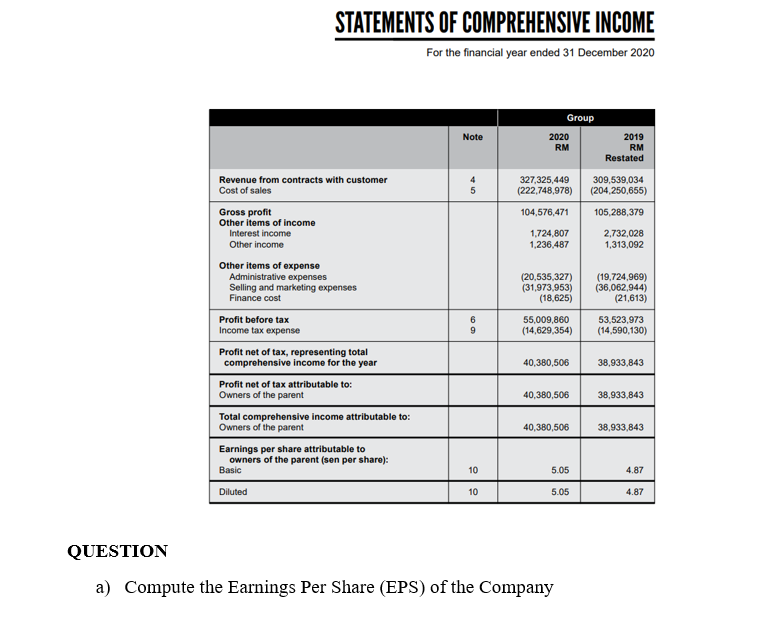
Question
1 Approved Answer
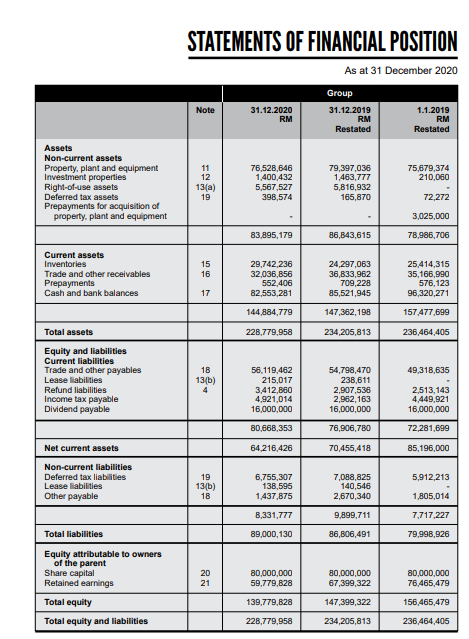
STATEMENTS OF FINANCIAL POSITION As at 31 December 2020 Note 31.12.2020 RM Group 31.12.2019 RM Restated 1.1.2019 RM Restated 75,679,374 210,060 Assets Non-current assets Property,
Step by Step Solution
There are 3 Steps involved in it
Step: 1

Get Instant Access to Expert-Tailored Solutions
See step-by-step solutions with expert insights and AI powered tools for academic success
Step: 2

Step: 3
Ace Your Homework with AI
Get the answers you need in no time with our AI-driven, step-by-step assistance
Get Started
Life Audit Workbook Meant For More
Authors: Agnese Iskrova
1st Edition
1716274958, 978-1716274954