Answered step by step
Verified Expert Solution
Question
1 Approved Answer
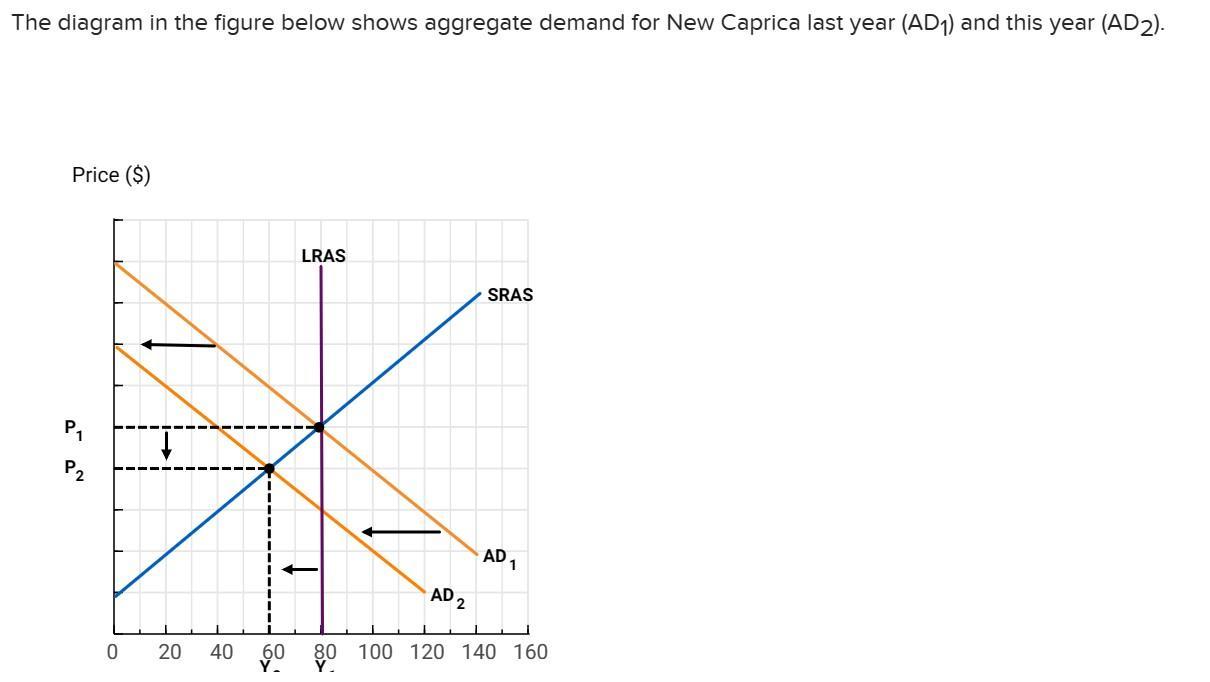
The diagram in the figure below shows aggregate demand for New Caprica last year (AD) and this year (AD2). Price ($) P P 0


The diagram in the figure below shows aggregate demand for New Caprica last year (AD) and this year (AD2). Price ($) P P 0 LRAS AD 2 SRAS AD 1 20 40 60 80 100 120 140 160 If you were to advise the president of New Caprica on economic policy, how would you answer the following? Instructions: Enter your answers as whole numbers. a. Current output is $ million. million, and potential output is $ million. There is (Click to select) of output of $ b. New Caprica is in a recession c. The president should enact expansionary fiscal policy. d. The aggregate demand curve would shift to the (Click to select) if the president used contractionary fiscal policy.
Step by Step Solution
★★★★★
3.42 Rating (149 Votes )
There are 3 Steps involved in it
Step: 1
ANSWER From the given graph and the associated questions following are the observations a Curre...
Get Instant Access to Expert-Tailored Solutions
See step-by-step solutions with expert insights and AI powered tools for academic success
Step: 2

Step: 3

Ace Your Homework with AI
Get the answers you need in no time with our AI-driven, step-by-step assistance
Get Started


