The diode I-V relation says if we plot
v_(D) versus
log(i_(D)), the resultant curve should be a\ straight line whose slope gives us the thermal voltage multiplied by the nonideality\ factor,
\\\\eta , and whose
y intercept gives us the reverse saturation current. (Verify this\ statement). We can also imagine that if measurement noise is included, retrieving model\ parameters becomes less exact.\ In Matlab, to fit data to a straight line, we can use the polyfit function\
C= polyfit(xdata,
ydata,n that fits the
x-y data to a polynomial of degree
n and stores the\ coefficients of the polynomial of best fit where
c(1) would be the highest degree\ coefficient,
c(2) is the next highest, etc.\ To see how this may work, imagine simultaneous voltage and current measurements\ across a
10ohm resistor so
V=10 I. If we sweep the current from
I=[1:1:10] and calculate\
V=10**I, and plot I versus
V, we would get a perfectly straight line whose slope is exactly\ the resistance. However, if the voltage measurement has noise that is added onto the\ voltage measurement, then when we do the line of best fit, the slope of the best fit line\ may not be perfectly accurate.\ Ex #3\ For the voltage current data discussed above, add noise to the voltage measurement with\ different values of noise fluctuations as measured by the STD so\ Vmeas
=V+ Vnoise* randn(ndata, 1) where Vnoise is the amplitude of the noise\ fluctuations and ndata is the number of data points. Choosing Vnoise
=1V, calculate the\ slope of the curve and store the result. Repeat 100 times adding the same noise amplitude\ and plot the histogram of resistance values. Repeat for Vnoise
=5V and Vnoise
=20V MATLAB CODE

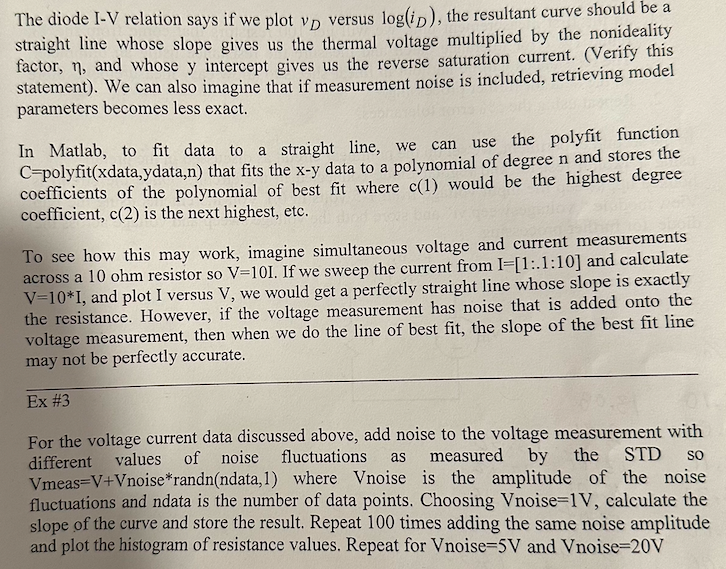
The diode I-V relation says if we plot vD versus log(iD), the resultant curve should be a straight line whose slope gives us the thermal voltage multiplied by the nonideality factor, , and whose y intercept gives us the reverse saturation current. (Verify this statement). We can also imagine that if measurement noise is included, retrieving model parameters becomes less exact. In Matlab, to fit data to a straight line, we can use the polyfit function C= polyfit(xdata,ydata,n) that fits the xy data to a polynomial of degree n and stores the coefficients of the polynomial of best fit where c(1) would be the highest degree coefficient, c(2) is the next highest, etc. To see how this may work, imagine simultaneous voltage and current measurements across a 10ohm resistor so V=10I. If we sweep the current from I=[1:.1:10] and calculate V=10I, and plot I versus V, we would get a perfectly straight line whose slope is exactly the resistance. However, if the voltage measurement has noise that is added onto the voltage measurement, then when we do the line of best fit, the slope of the best fit line may not be perfectly accurate. Ex\#3 For the voltage current data discussed above, add noise to the voltage measurement with different values of noise fluctuations as measured by the STD so Vmeas =V+ Vnoise* randn(ndata, 1 ) where Vnoise is the amplitude of the noise fluctuations and ndata is the number of data points. Choosing Vnoise =1V, calculate the slope of the curve and store the result. Repeat 100 times adding the same noise amplitude and plot the histogram of resistance values. Repeat for Vnoise =5V and Vnoise =20V The diode I-V relation says if we plot vD versus log(iD), the resultant curve should be a straight line whose slope gives us the thermal voltage multiplied by the nonideality factor, , and whose y intercept gives us the reverse saturation current. (Verify this statement). We can also imagine that if measurement noise is included, retrieving model parameters becomes less exact. In Matlab, to fit data to a straight line, we can use the polyfit function C= polyfit(xdata,ydata,n) that fits the xy data to a polynomial of degree n and stores the coefficients of the polynomial of best fit where c(1) would be the highest degree coefficient, c(2) is the next highest, etc. To see how this may work, imagine simultaneous voltage and current measurements across a 10ohm resistor so V=10I. If we sweep the current from I=[1:.1:10] and calculate V=10I, and plot I versus V, we would get a perfectly straight line whose slope is exactly the resistance. However, if the voltage measurement has noise that is added onto the voltage measurement, then when we do the line of best fit, the slope of the best fit line may not be perfectly accurate. Ex\#3 For the voltage current data discussed above, add noise to the voltage measurement with different values of noise fluctuations as measured by the STD so Vmeas =V+ Vnoise* randn(ndata, 1 ) where Vnoise is the amplitude of the noise fluctuations and ndata is the number of data points. Choosing Vnoise =1V, calculate the slope of the curve and store the result. Repeat 100 times adding the same noise amplitude and plot the histogram of resistance values. Repeat for Vnoise =5V and Vnoise =20V


