Answered step by step
Verified Expert Solution
Question
1 Approved Answer
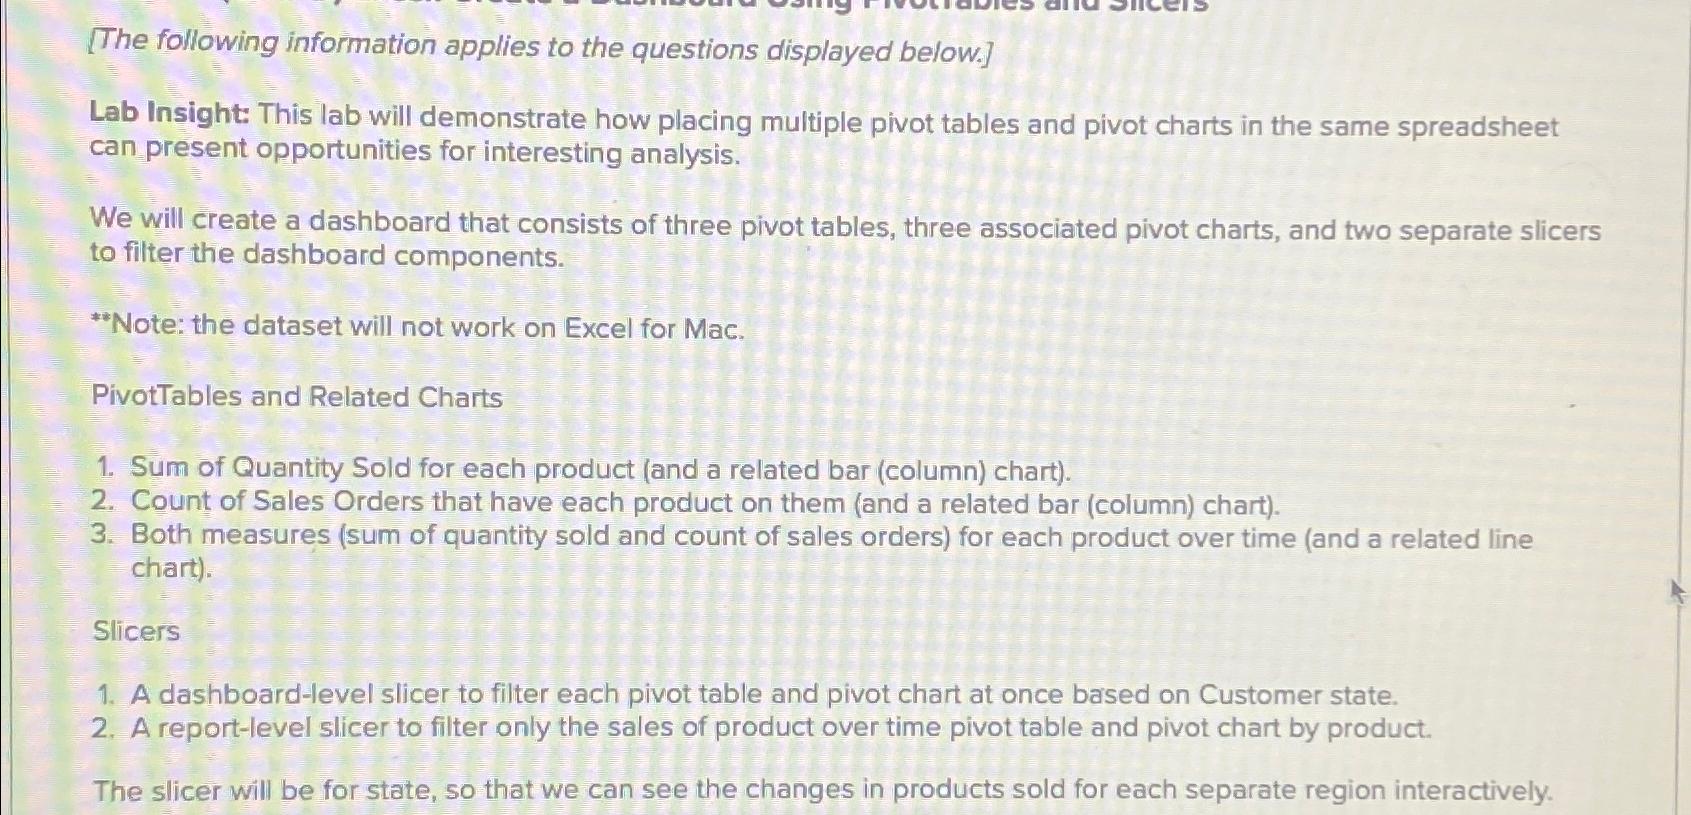
[ The following information applies to the questions displayed below. ] Lab Insight: This lab will demonstrate how placing multiple pivot tables and pivot charts
The following information applies to the questions displayed below.
Lab Insight: This lab will demonstrate how placing multiple pivot tables and pivot charts in the same spreadsheet can present opportunities for interesting analysis.
We will create a dashboard that consists of three pivot tables, three associated pivot charts, and two separate slicers to filter the dashboard components.
Note: the dataset will not work on Excel for Mac.
PivotTables and Related Charts
Sum of Quantity Sold for each product and a related bar column chart
Count of Sales Orders that have each product on them and a related bar column chart
Both measures sum of quantity sold and count of sales orders for each product over time and a related line chart
Slicers
A dashboardlevel slicer to filter each pivot table and pivot chart at once based on Customer state.
A reportlevel slicer to filter only the sales of product over time pivot table and pivot chart by product.
The slicer will be for state, so that we can see the changes in products sold for each separate region interactively.

Step by Step Solution
There are 3 Steps involved in it
Step: 1

Get Instant Access to Expert-Tailored Solutions
See step-by-step solutions with expert insights and AI powered tools for academic success
Step: 2

Step: 3

Ace Your Homework with AI
Get the answers you need in no time with our AI-driven, step-by-step assistance
Get Started


