Question: The purpose of this project is to model the dynamics involved in introducing population of 100 deer into an area dynamics consisting of a patchwork
The purpose of this project is to model the dynamics involved in introducing population of 100 deer into an area "dynamics" consisting of a patchwork of grassland and forest. By we mean we want to predict the type of behavior seen (growing, declining, we measure the plant density in logistic type 44 in a given year Rather than count individual plants, appropriate density units. In the absence of deer, the plants observe oscillating, chaotic), and we are not interested in predicting actual numbers of animals a growth with a growth rate of 0.8 when the plant density is low and a growth rate near 0 when the plant density is near 3,000 density units. Initially the area is ungrazed, so we assume that the initial plant density is 3,000 units. The deer herd eats the plants, of grazed flat, the herd will decline at a rate of 1.1. (That is, the number of deer lost in a year is 1.1 times the number of deer. This seems impossible, but it only means that the herd would be gone in less than a year course, and when the vegetation is burned out or roughly linear with no food.) When food is present, this decline is offset by a growth term which has a rate of 0 when plant density is 0, 1.5 when plant density is 3,000, and is (assume it is linear) in between. (Note this is the growth rate, not the actual number of present, the plant density is diminished. Each deer deer.) Similarly when deer are cat as much as 1.2 density units per year when food is plentiful (plant density of 3,000), but as food becomes scarcer, the deer will eat less with no food eaten when there is no food available. Again assume a linear relationship between eating no food when the plant density is zero and 1.2 density units when the density is 3,000.

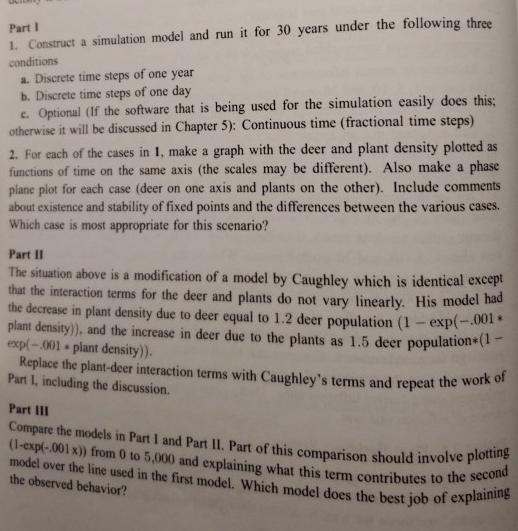
Part 1 1. Construct a simulation model and run it for 30 years under the following three conditions a. Discrete time steps of one year b. Discrete time steps of one day c. Optional (If the software that is being used for the simulation easily does this; otherwise it will be discussed in Chapter 5): Continuous time (fractional time steps) 2. For each of the cases in 1, make a graph with the deer and plant density plotted as functions of time on the same axis (the scales may be different). Also make a phase plane plot for each case (deer on one axis and plants on the other). Include comments about existence and stability of fixed points and the differences between the various cases. Which case is most appropriate for this scenario? Part II The situation above is a modification of a model by Caughley which is identical except that the interaction terms for the deer and plants do not vary linearly. His model had the decrease in plant density due to deer equal to 1.2 deer population (1-exp(-.001* plant density)), and the increase in deer due to the plants as 1.5 deer population (1- exp(-001 plant density)). . Replace the plant-deer interaction terms with Caughley's terms and repeat the work of Part I, including the discussion. Part III Compare the models in Part I and Part II. Part of this comparison should involve plotting (1-exp(-.001 x)) from 0 to 5,000 and explaining what this term contributes to the second model over the line used in the first model. Which model does the best job of explaining the observed behavior?
Step by Step Solution
3.57 Rating (157 Votes )
There are 3 Steps involved in it
ANSWER Part I The first model is a simple linear model with a plant densitydependent term and a deer densitydependent term The plant density term repr... View full answer

Get step-by-step solutions from verified subject matter experts


