

Question: The y-axis is labelled $ (Millions) and rises from negative 10 to 20 in increments of 5. The x-axis is labelled Growth Rate and ranges
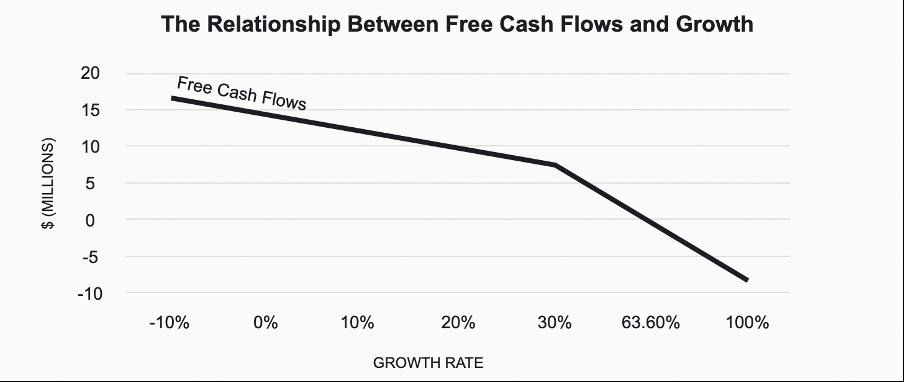
The y-axis is labelled $ (Millions) and rises from negative 10 to 20 in increments of 5. The x-axis is labelled Growth Rate and ranges from negative 10 percent to 100 percent, in increments of 10 until 30 percent, then jumps to 63.60 percent and then to 100 percent. The free cash flows line begins at $16.2 at negative 10 percent and gradually diagonally descends to $7.4 at 30 percent. The line then steeply diagonally descends to negative $8 by 100 percent.
Why do you think free cash flows decreased to $0 when sales growth was 63.6%?
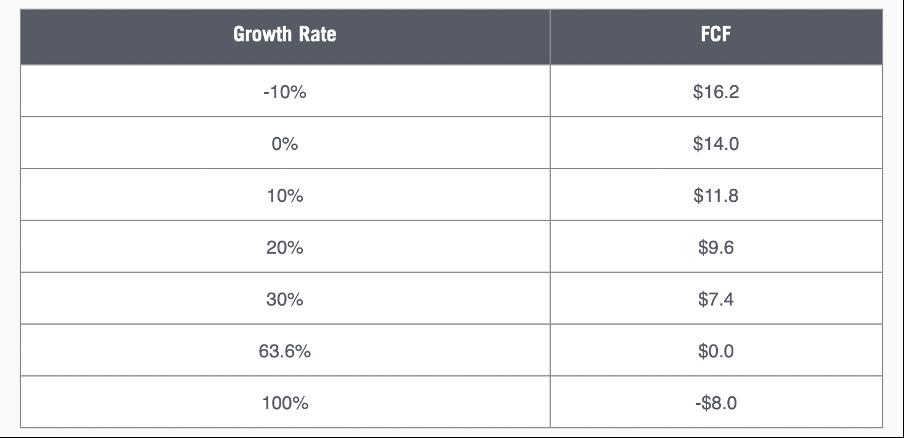
Growth Rate -10% 0% 10% 20% 30% 63.6% 100% FCF $16.2 $14.0 $11.8 $9.6 $7.4 $0.0 -$8.0
Step by Step Solution
3.48 Rating (168 Votes )
There are 3 Steps involved in it
Here are the possible reasons why free cash flows decreased to 0 when sales growth was 636 1 Diminis... View full answer

Get step-by-step solutions from verified subject matter experts