

Answered step by step
Verified Expert Solution
Question
1 Approved Answer
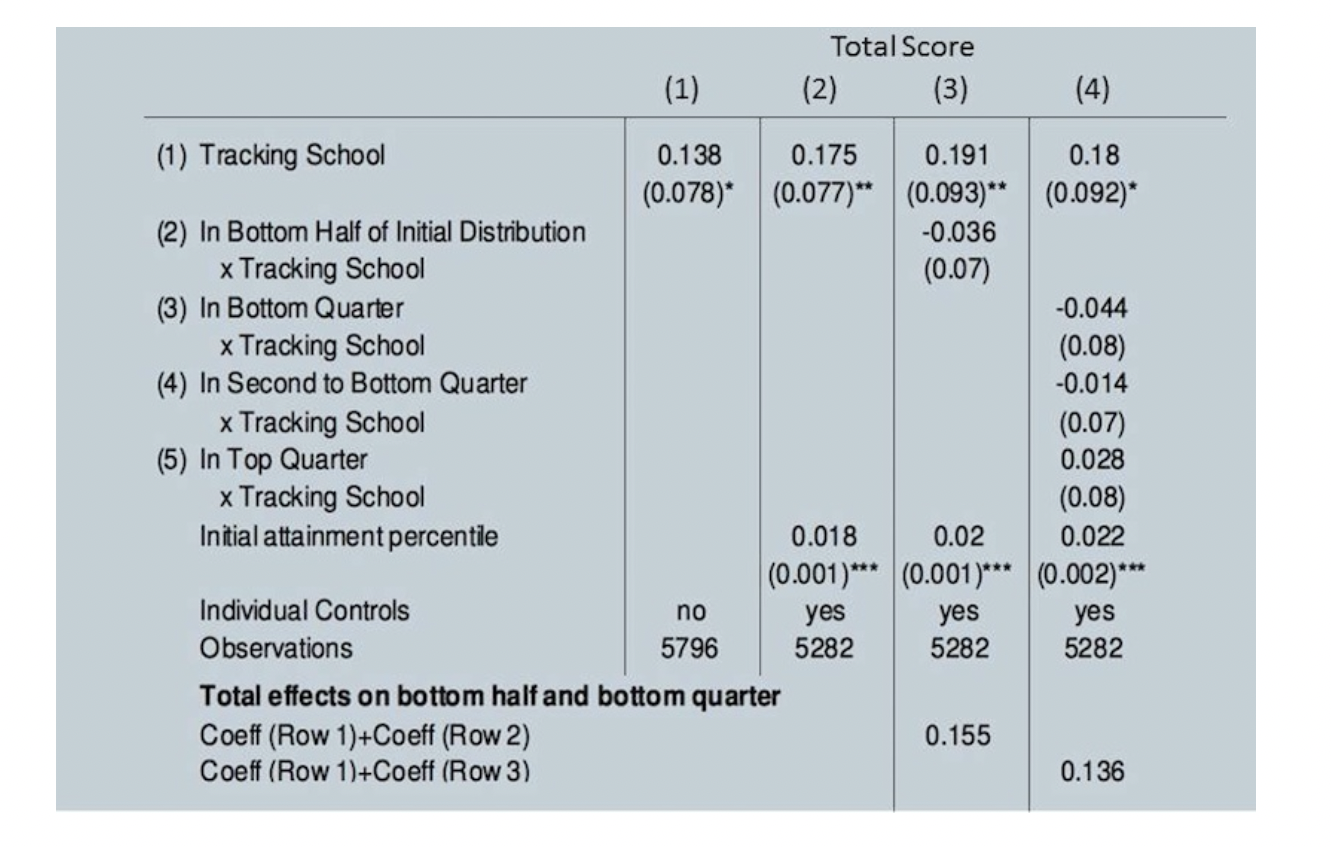
Total Score (1) (2 ) (3) (4) (1) Tracking School 0.138 0.175 0.191 0.18 (0.078)* (0.077)** (0.093)** (0.092) (2) In Bottom Half of Initial Distribution
Step by Step Solution
There are 3 Steps involved in it
Step: 1

Get Instant Access to Expert-Tailored Solutions
See step-by-step solutions with expert insights and AI powered tools for academic success
Step: 2

Step: 3
Ace Your Homework with AI
Get the answers you need in no time with our AI-driven, step-by-step assistance
Get Started
Managerial Economics A Problem-Solving Approach
Authors: Luke M. Froeb, Brain T. Mccann
2nd Edition
B00BTM8FK0