Use the data obtained to complete a scatter plot graph of In[t-BuCl] vs time
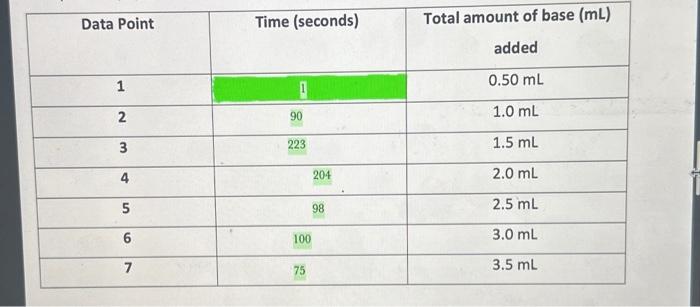
- the first table is the data i got during the experiment
this is the info i have please help me asap please
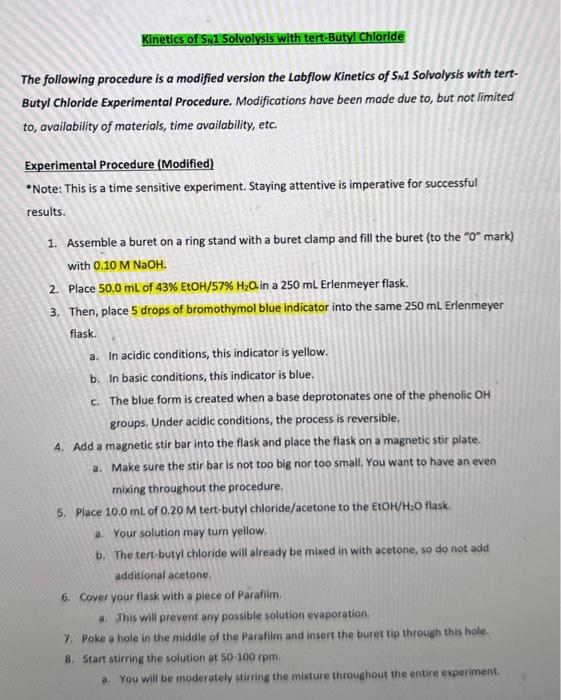
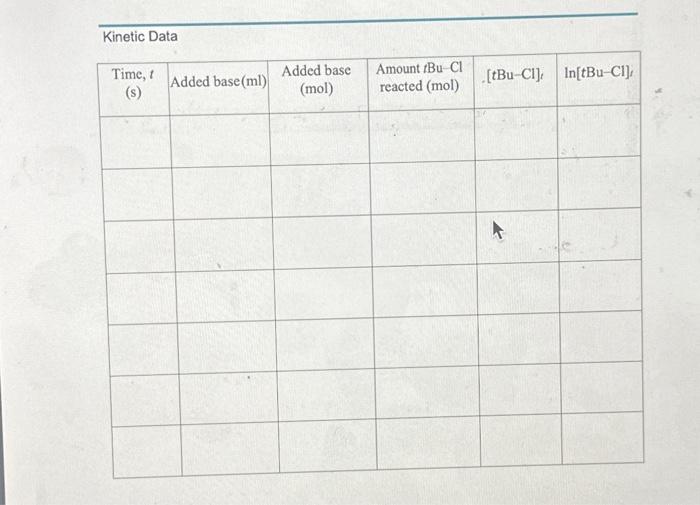
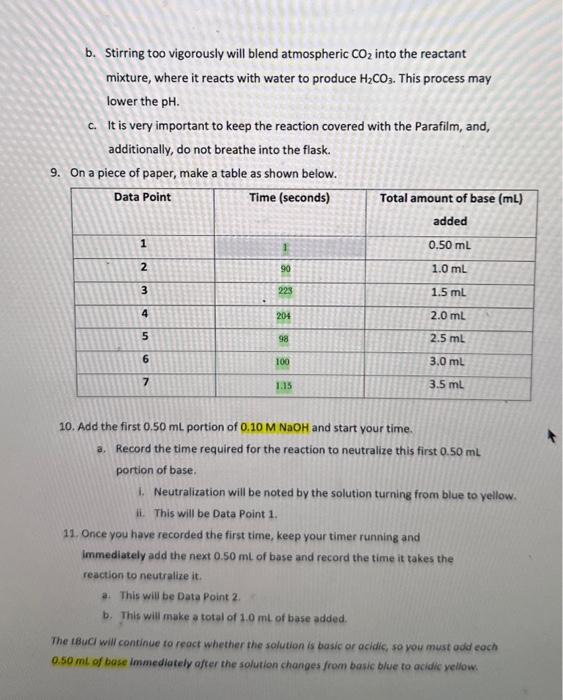
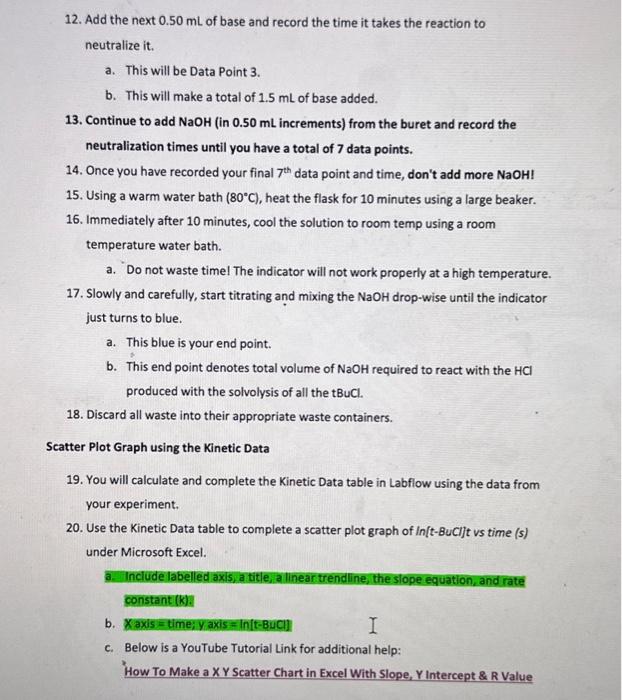
\begin{tabular}{|c|c|c|} \hline Data Point & Time (seconds) & Totalamountofbase(mL)added \\ \hline 1 & 1 & 0.50mL \\ \hline 2 & 90 & 1.0mL \\ \hline 3 & 223 & 1.5mL \\ \hline 4 & 204 & 2.0mL \\ \hline 5 & 98 & 2.5mL \\ \hline 6 & 100 & 3.0mL \\ \hline 7 & 75 & 3.5mL \\ \hline \end{tabular} Linntio Naka Kinetics of SN1 Solvolysis with tert-Buty Chloride The following procedure is a modified version the Labflow Kinetics of SN1 Solvolysis with tertButyl Chloride Experimental Procedure. Modifications have been made due to, but not limited to, availability of materials, time availability, etc. Experimental Procedure (Modified) *Note: This is a time sensitive experiment. Staying attentive is imperative for successful results. 1. Assemble a buret on a ring stand with a buret clamp and fill the buret (to the " 0 " mark) with 0.10MNaOH. 2. Place 50.0mL of 43%EtOH/57%H2 O in a 250mL Erlenmeyer flask. 3. Then, place 5 drops of bromothymol blue indicator into the same 250mL Erlenmeyer flask. a. In acidic conditions, this indicator is yellow. b. In basic conditions, this indicator is blue. c. The blue form is created when a base deprotonates one of the phenolic OH groups. Under acidic conditions, the process is reversible. 4. Add a magnetic stir bar into the flask and place the flask on a magnetic stir plate. a. Make sure the stir bar is not too big nor too small. You want to have an even mixing throughout the procedure. 5. Place 10.0mL of 0.20M tert-butyl chloride/acetone to the EtO/H2O flask a. Your solution may turn yellow. b. The tert-butyl chloride will already be mixed in with acetone, so do not add additional acetone. 6. Cover your flask with a plece of Parafilm. a. This will prevent any possible solution evaporation. 7. Poke a hole in the middle of the Parafilm and insert the buret tip through this hole. 8. Start stirring the solution at 50100rpm. a. You will be moderately stirring the mixture throughout the entire experiment. b. Stirring too vigorously will blend atmospheric CO2 into the reactant mixture, where it reacts with water to produce H2CO3. This process may lower the pH. c. It is very important to keep the reaction covered with the Parafilm, and, additionally, do not breathe into the flask. 9. On a piece of paper, make a table as shown below. 10. Add the first 0.50mL portion of 0.10MNaOH and start your time. a. Record the time required for the reaction to neutralize this first 0.50mL portion of base. I. Neutralization will be noted by the solution turning from blue to yellow. ii. This will be Data Point 1 . 12. Once you have recorded the first time, keep your timer running and immediately add the next 0.50mL of base and record the time it takes the reaction to neutralize it. a. This will be Data Point 2 . b. This will make a total of 1.0mL of base added. The tBucI will continue to reacr whether the solution is basic or acidic, so you must odd each 0.50mt of bose immediately ofter the solution changes from basic blue to acidic yellow. 12. Add the next 0.50mL of base and record the time it takes the reaction to neutralize it. a. This will be Data Point 3. b. This will make a total of 1.5mL of base added. 13. Continue to add NaOH (in 0.50mL increments) from the buret and record the neutralization times until you have a total of 7 data points. 14. Once you have recorded your final 7th data point and time, don't add more NaOH! 15. Using a warm water bath (80C), heat the flask for 10 minutes using a large beaker. 16. Immediately after 10 minutes, cool the solution to room temp using a room temperature water bath. a. Do not waste timel The indicator will not work properly at a high temperature. 17. Slowly and carefully, start titrating and mixing the NaOH drop-wise until the indicator just turns to blue. a. This blue is your end point. b. This end point denotes total volume of NaOH required to react with the HCl produced with the solvolysis of all the tBuCl. 18. Discard all waste into their appropriate waste containers. Scatter Plot Graph using the Kinetic Data 19. You will calculate and complete the Kinetic Data table in Labflow using the data from your experiment. 20. Use the Kinetic Data table to complete a scatter plot graph of In[t-BuCl)t vs time (s) under Microsoft Excel. a. Include labelled axis; a title, a linear trendline, the slope equation, and rate constant (k). b. X axis = time; Y a axis =ln[tBuc] c. Below is a YouTube Tutorial Link for additional help: How To Make a X Y Scatter Chart in Excel With Slope, Y Intercept \& R Value
