Use this historical data to find the probability that a randomly selected resident in this small town owns more than one vehicle.
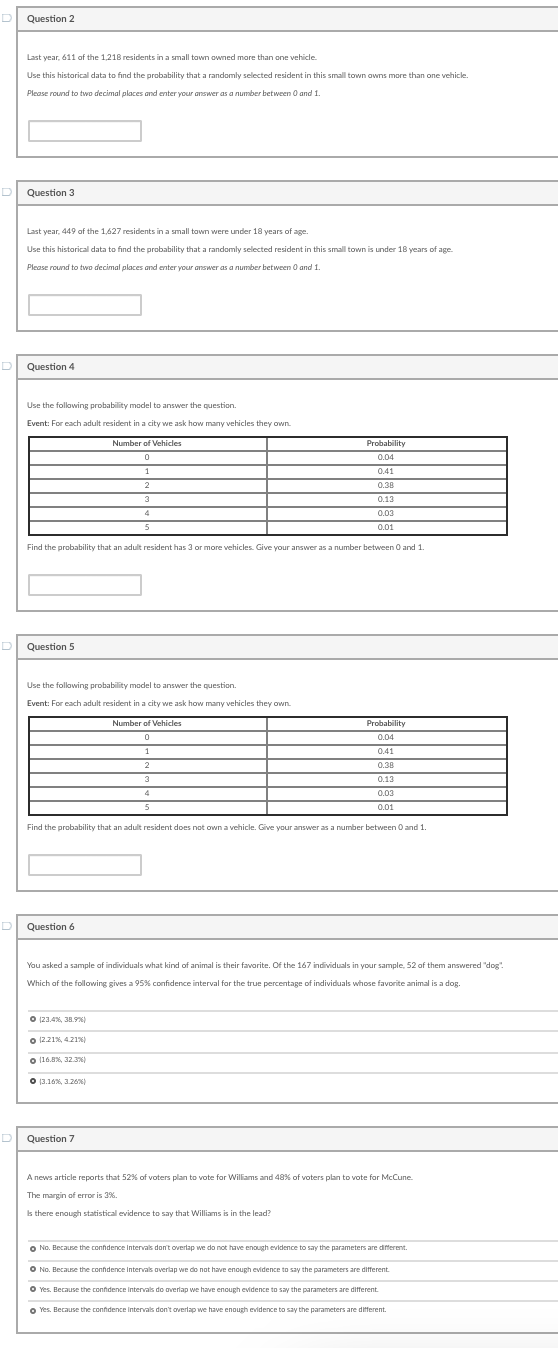
Question 2 Last year, 611 of the 1,218 residents in a small town owned more than one vehicle. Use this historical data to find the probability that a randomly selected resident in this small town owns more than one vehicle. Please round to two decimal places and enter your answer as a number between O and 1. Question 3 Last year, 449 of the 1,427 residents in a small town were under 18 years of age. Use this historical data to find the probability that a randomly selected resident in this small town is under 18 years of age. Please round to two decimal places and enter your answer as a number between O and 1. Question 4 Use the following probability model to answer the question. Event: For each adult resident in a city we ask how many vehicles they own. Number of Vehicles Probability 0 0.04 0.41 2 0.38 3 0.13 4 0.03 0.01 Find the probability that an adult resident has 3 or more vehicles. Give your answer as a number between O and 1. Question 5 Use the following probability model to answer the question. Event: For each adult resident in a city we ask how many vehicles they own. Number of Vehicles Probability 0 0.04 0.41 2 0.38 3 0.13 0.03 0.01 Find the probability that an adult resident does not own a vehicle. Give your answer as a number between 0 and 1. Question 6 You asked a sample of individuals what kind of animal is their favorite. Of the 147 individuals in your sample, 52 of them answered "dog"- Which of the following gives a 95% confidence interval for the true percentage of individuals whose favorite animal is a dog. 0 (23.4%%, 38.976) (2.21%, 4 21%) (16.876, 32.376) 0 (3.14%, 3 2676) Question 7 A news article reports that 52% of voters plan to vote for Williams and 48% of voters plan to vote for Mccune. The margin of error is 3%. Is there enough statistical evidence to say that Williams is in the lead? o No. Because the confidence Intervals don't overlap we do not have enough evidence to say the parameters are different. 0 No. Because the confidence Intervals overlap we do not have enough evidence to say the parameters are different. Q Yes. Because the confidence Intervals do overlap we have enough evidence to say the parameters are different Yes. Because the confidence Intervals don't overlap we have enough evidence to say the parameters are different


