Using three unique variables highlighted in green (1. Growth Rate of Sales, 2. Long-term Growth Rate of Free Cash Flows of the Firm after Year 5, and 3. Discount Rate or the Unlevered Weighted Average Cost of Capital or WACC), and the provided Income Statement and provided Balance Sheet, each student must complete four items:
1) Unlevered Free Cash Flows of the Firm (FCFF) for the first five years
2) Present Values of the FCFF for the first five years
3) Present Value of the Terminal Value
4) The Firms overall Present Value as of today
You need to ensure that the Balance Sheet "balances" correctly. You will to manually adjust either/both two line items in the Balance Sheet.
- These two line items are: CASH & EQUIVALENTS ON THE ASSET SIDE AND "REVOLVING LINE OF CREDIT" ON THE LIABILITY SIDE WITHIN CURRENT ASSETS.
Your manual adjustments are based upon the following considerations:
- If assets are less than (Liabilities + Equity), then you must increase the cash & equivalents until assets equal (Liabilities + Equity) for that year. Do this for each of the 5 years shown. F
- If assets are greater than (Liabilities + Equity), then you must increase the revolving line until (Liabilities + Equity) equal assets that year. Do this for each of the five years shown.
Please show your work/calculations.
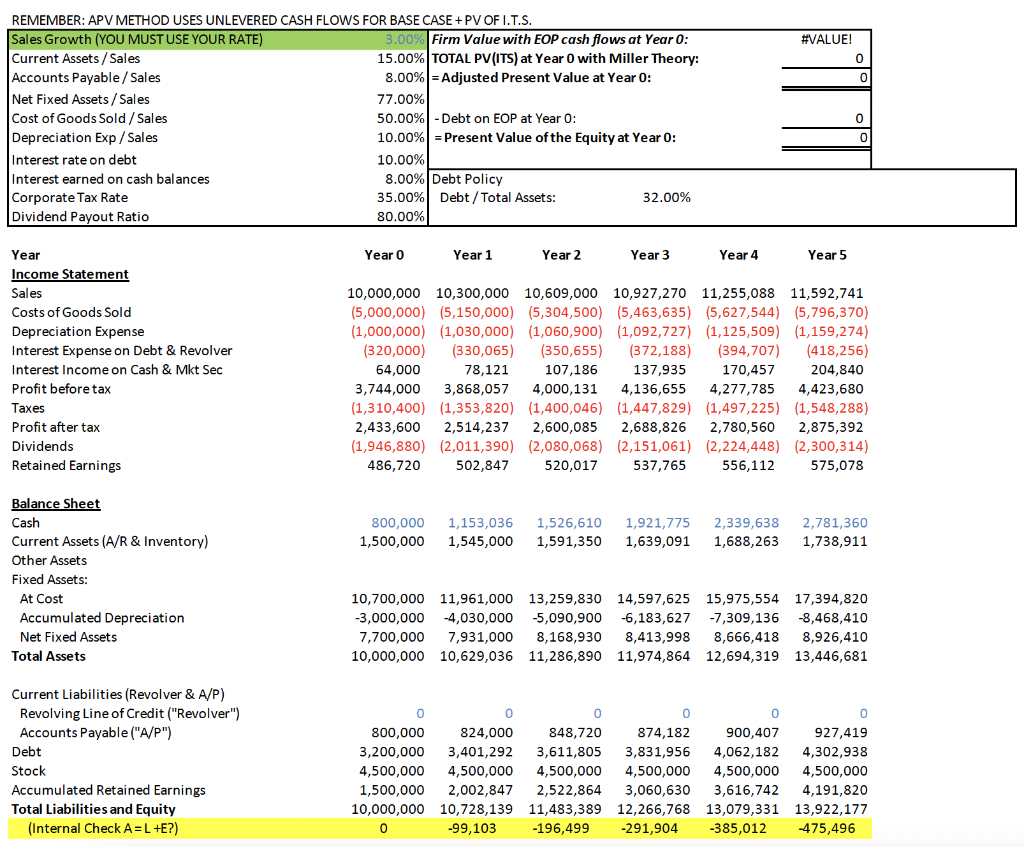
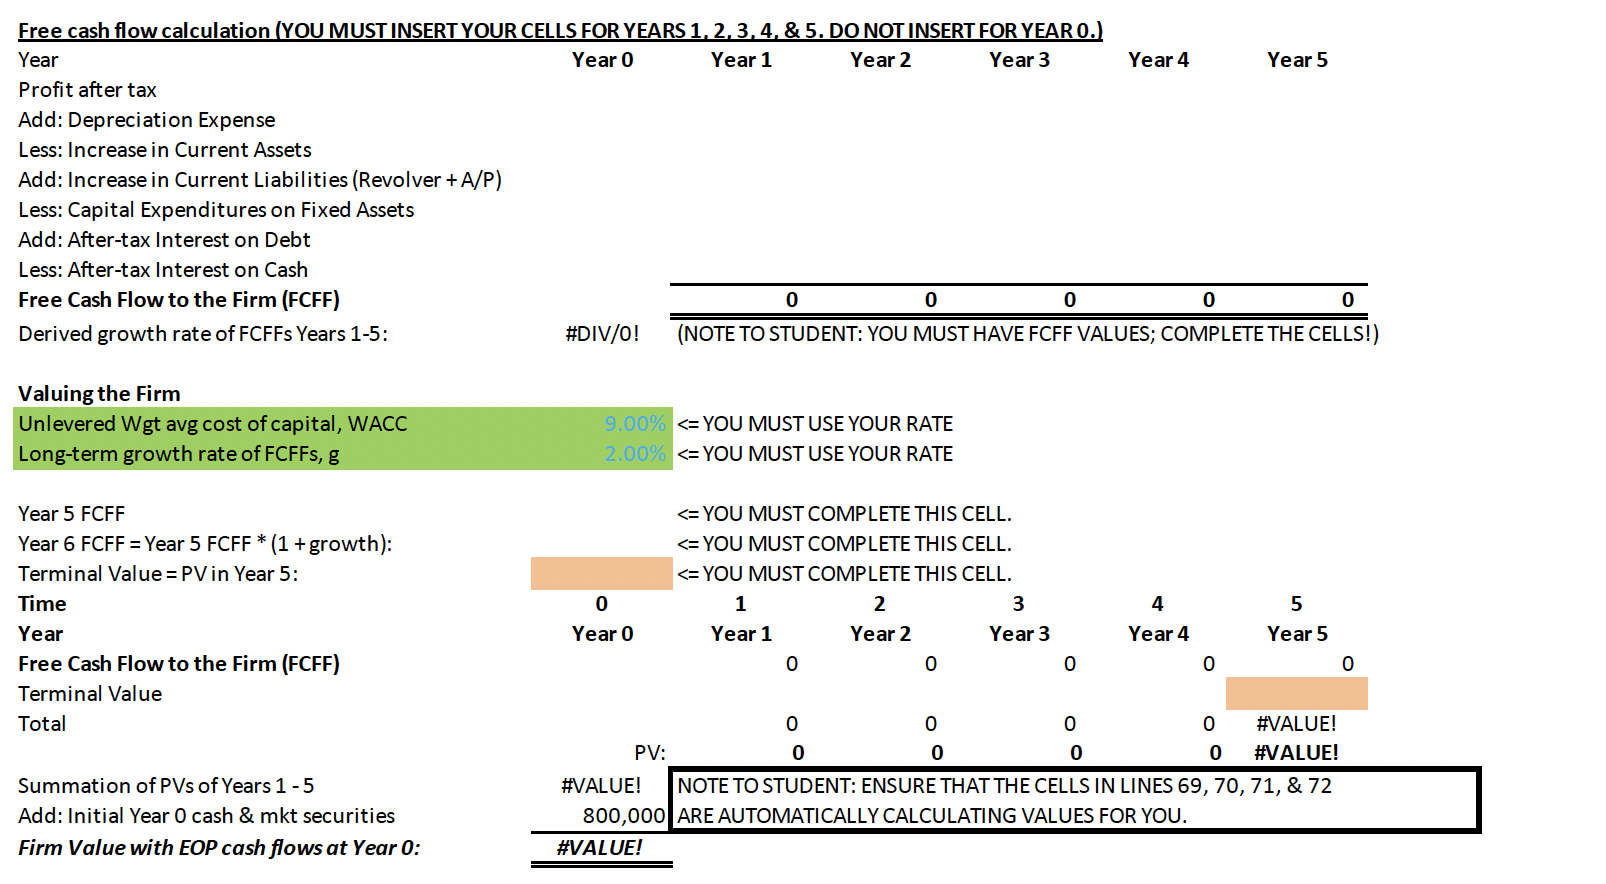
#VALUE! 0 0 REMEMBER: APV METHOD USES UNLEVERED CASH FLOWS FOR BASE CASE + PV OF I.T.S. Sales Growth (YOU MUST USE YOUR RATE) 3.00% Firm Value with EOP cash flows at Year 0: Current Assets / Sales 15.00% TOTAL PV(ITS) at Year 0 with Miller Theory: Accounts Payable / Sales 8.00% = Adjusted Present Value at Year 0: Net Fixed Assets / Sales 77.00% Cost of Goods Sold / Sales 50.00% - Debt on EOP at Year 0: Depreciation Exp/Sales 10.00% = Present Value of the Equity at Year 0: Interest rate on debt 10.00% Interest earned on cash balances 8.00% Debt Policy Corporate Tax Rate 35.00% Debt / Total Assets: 32.00% Dividend Payout Ratio 80.00% 0 0 Year 0 Year 1 Year 2 Year 3 Year 4 Year 5 Year Income Statement Sales Costs of Goods Sold Depreciation Expense Interest Expense on Debt & Revolver Interest Income on Cash & Mkt Sec Profit before tax Taxes Profit after tax Dividends Retained Earnings 10,000,000 10,300,000 10,609,000 10,927,270 11,255,088 11,592,741 (5,000,000) (5,150,000) (5,304,500) (5,463,635) (5,627,544) (5,796,370) (1,000,000) (1,030,000) (1,060,900) (1,092,727) (1,125,509) (1,159,274) (320,000) (330,065) (350,655) (372,188) (394,707) (418,256) 64,000 78,121 107,186 137,935 170,457 204,840 3,744,000 3,868,057 4,000,131 4,136,655 4,277,785 4,423,680 (1,310,400) (1,353,820) (1,400,046) (1,447,829) (1,497,225) (1,548,288) 2,433,600 2,514,237 2,600,085 2,688,826 2,780,560 2,875,392 (1,946,880) (2,011,390) (2,080,068) (2,151,061) (2,224,448) (2,300,314) 486,720 502,847 520,017 537,765 556,112 575,078 800,000 1,500,000 1,153,036 1,545,000 1,526,610 1,591,350 1,921,775 1,639,091 2,339,638 1,688,263 2,781,360 1,738,911 Balance Sheet Cash Current Assets (A/R & Inventory) Other Assets Fixed Assets: At Cost Accumulated Depreciation Net Fixed Assets Total Assets 10,700,000 11,961,000 13,259,830 14,597,625 15,975,554 17,394,820 -3,000,000 -4,030,000 -5,090,900 -6,183,627 -7,309,136 -8,468,410 7,700,000 7,931,000 8,168,930 8,413,998 8,666,418 8,926,410 10,000,000 10,629,036 11,286,890 11,974,864 12,694,319 13,446,681 Current Liabilities (Revolver & A/P) Revolving Line of Credit ("Revolver") Accounts Payable ("A/P") Debt Stock Accumulated Retained Earnings Total Liabilities and Equity (Internal Check A=L +E?) 0 0 800,000 824,000 848,720 874,182 3,200,000 3,401,292 3,611,805 3,831,956 4,500,000 4,500,000 4,500,000 4,500,000 1,500,000 2,002,847 2,522,864 3,060,630 10,000,000 10,728,139 11,483,389 12,266,768 0 -99,103 -196,499 -291,904 0 900,407 4,062,182 4,500,000 3,616,742 13,079,331 -385,012 0 927,419 4,302,938 4,500,000 4,191,820 13,922,177 475,496 Free cash flow calculation (YOU MUST INSERT YOUR CELLS FOR YEARS 1, 2, 3, 4, & 5. DO NOT INSERT FOR YEAR O.) Year Year o Year 1 Year 2 Year 3 Year 4 Year 5 Profit after tax Add: Depreciation Expense Less: Increase in Current Assets Add: Increase in Current Liabilities (Revolver + A/P) Less: Capital Expenditures on Fixed Assets Add: After-tax Interest on Debt Less: After-tax Interest on Cash Free Cash Flow to the Firm (FCFF) 0 0 0 0 0 Derived growth rate of FCFFs Years 1-5: #DIV/0! (NOTE TO STUDENT: YOU MUST HAVE FCFF VALUES; COMPLETE THE CELLS!) Valuing the Firm Unlevered Wgt avg cost of capital, WACC Long-term growth rate of FCFFs, g 9.00%