What is the customer acquisition cost (CAC) based on the data available from the first TV test (Exhibit 12)? (Hint: To calculate the number of
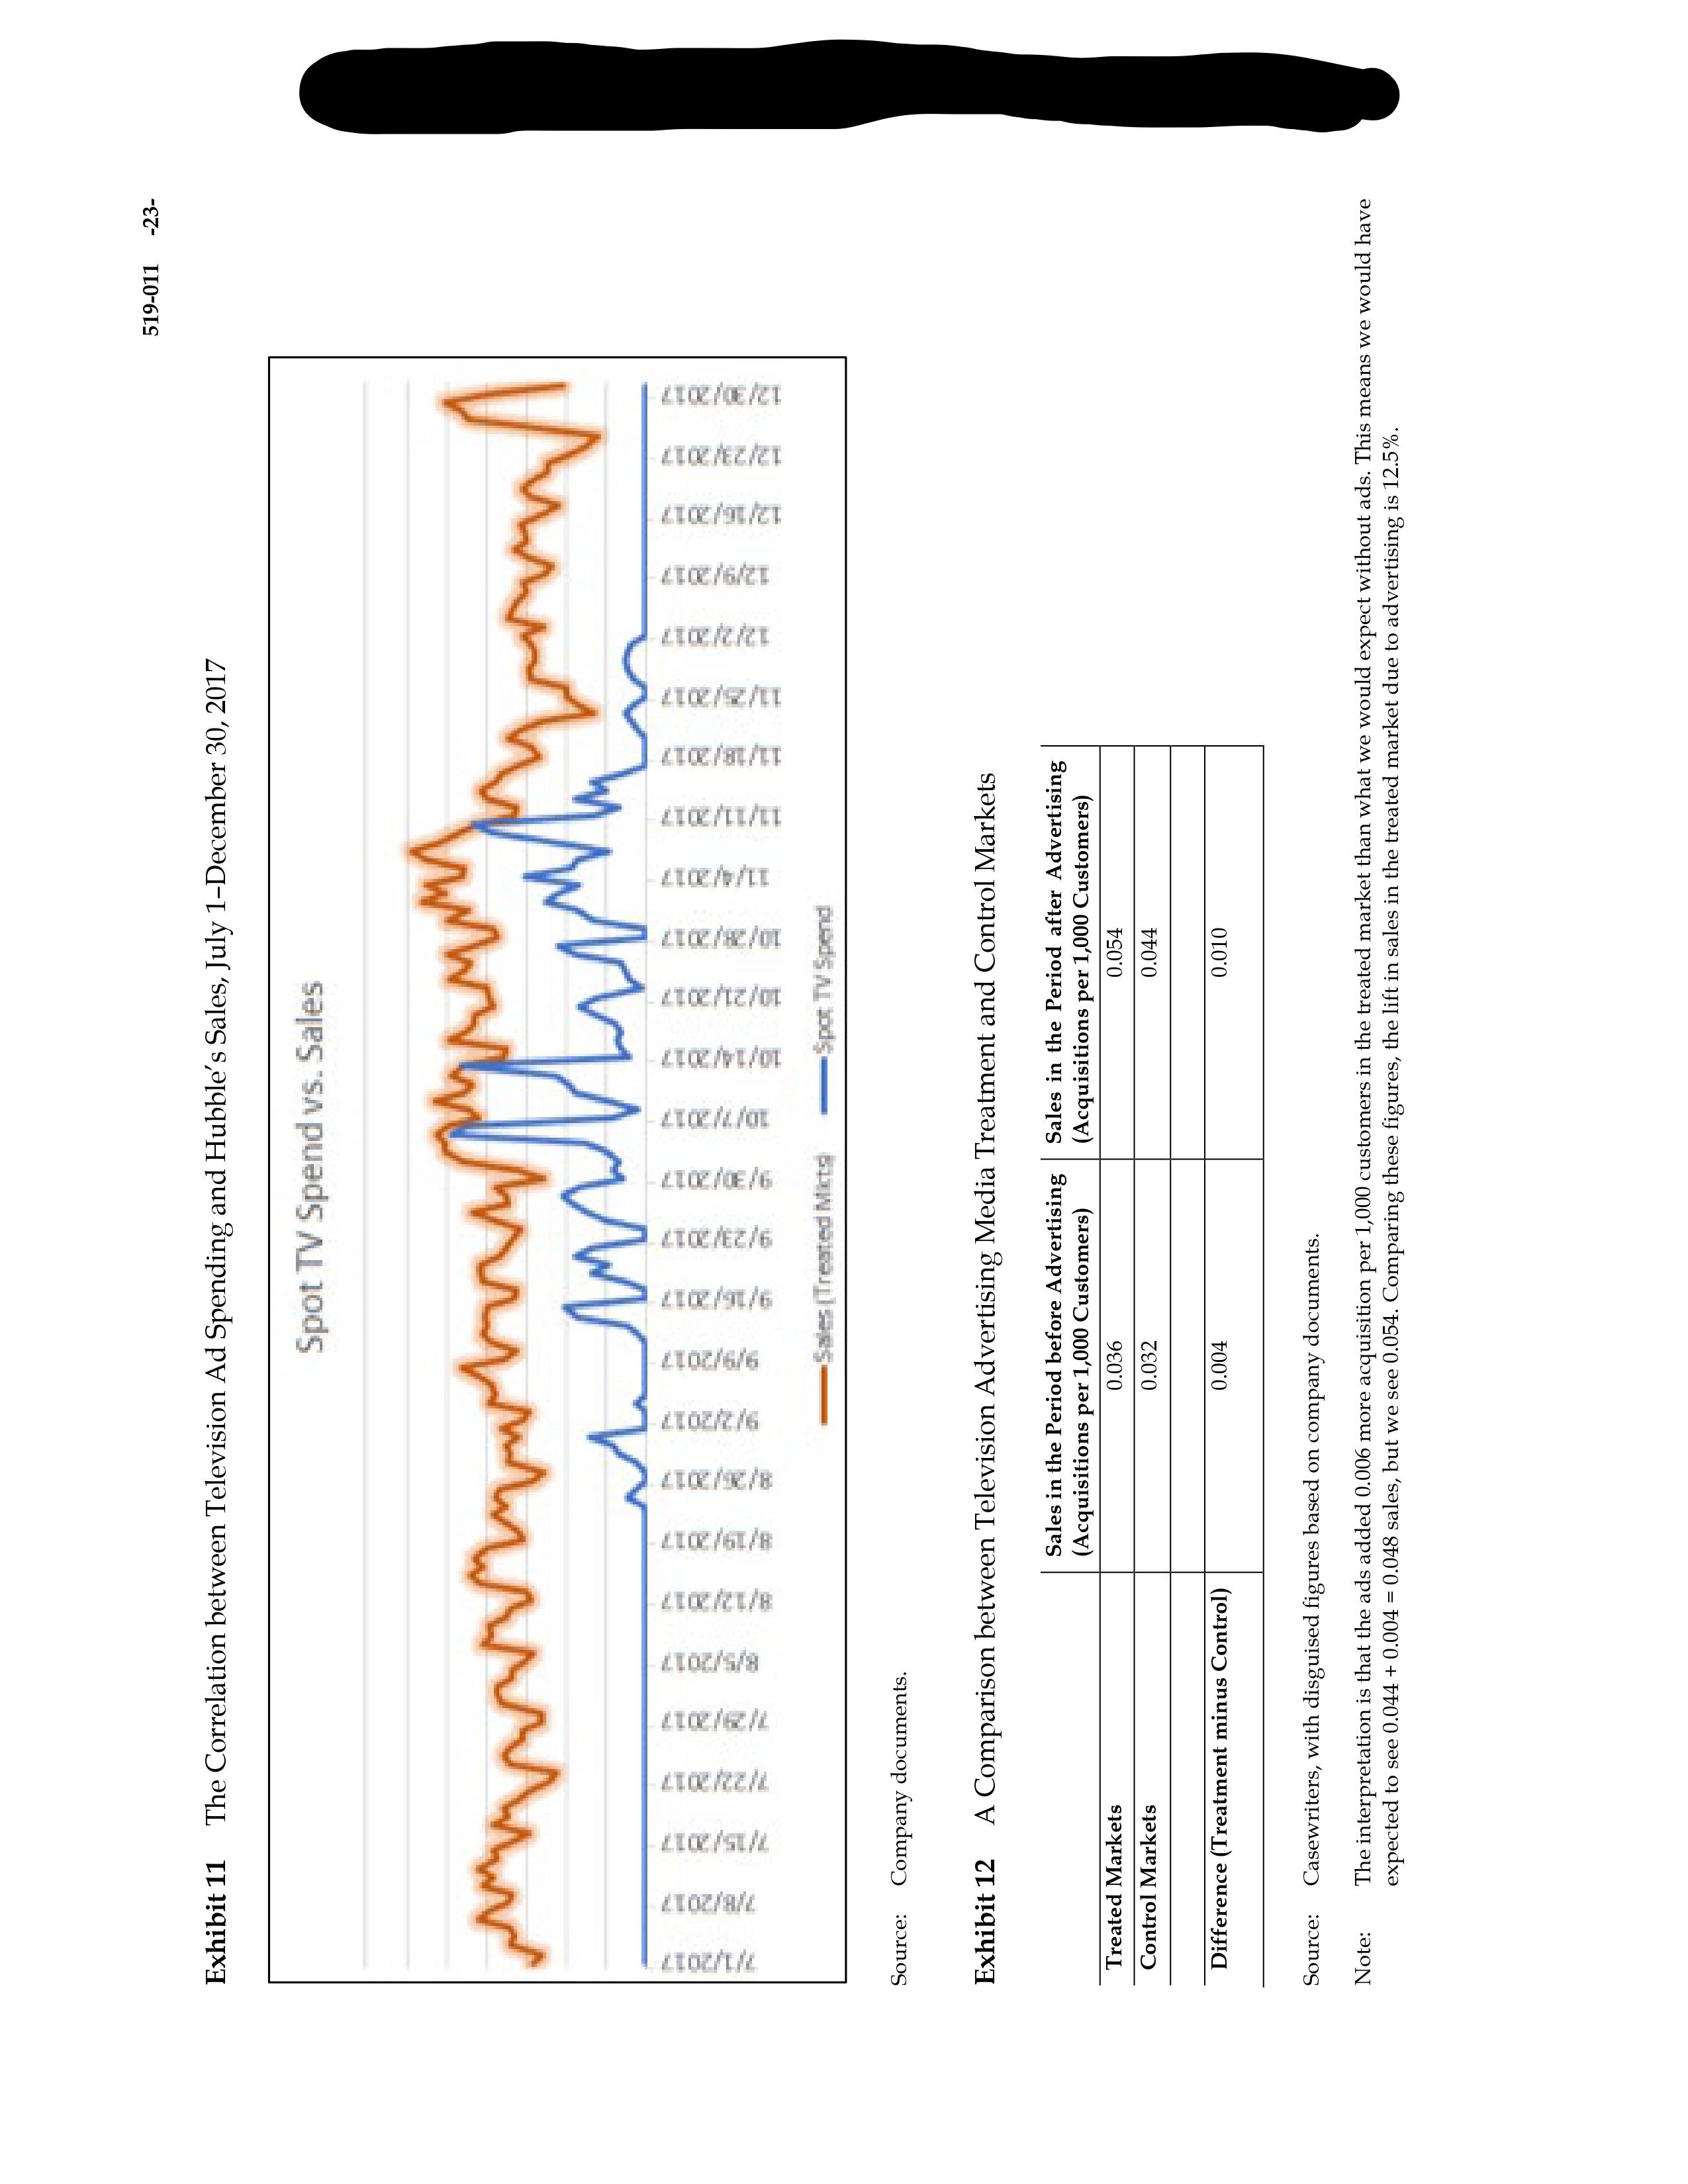
What is the customer acquisition cost (CAC) based on the data available from the first TV test (Exhibit 12)? (Hint: To calculate the number of new customers acquired, use the values (i) Additional customer acquisitions (i.e., 0.006 per 1000) and (ii) total number of impressions of the TV ad.). If you get acquisitions of .006 per 1000, how many acquisitions will you get for 279 million (i.e., the total number of impressions/customers)? After you have the total number of new customers acquired, divide it by $1 million (Ad spend) by the number of customers acquired to obtain CAC.
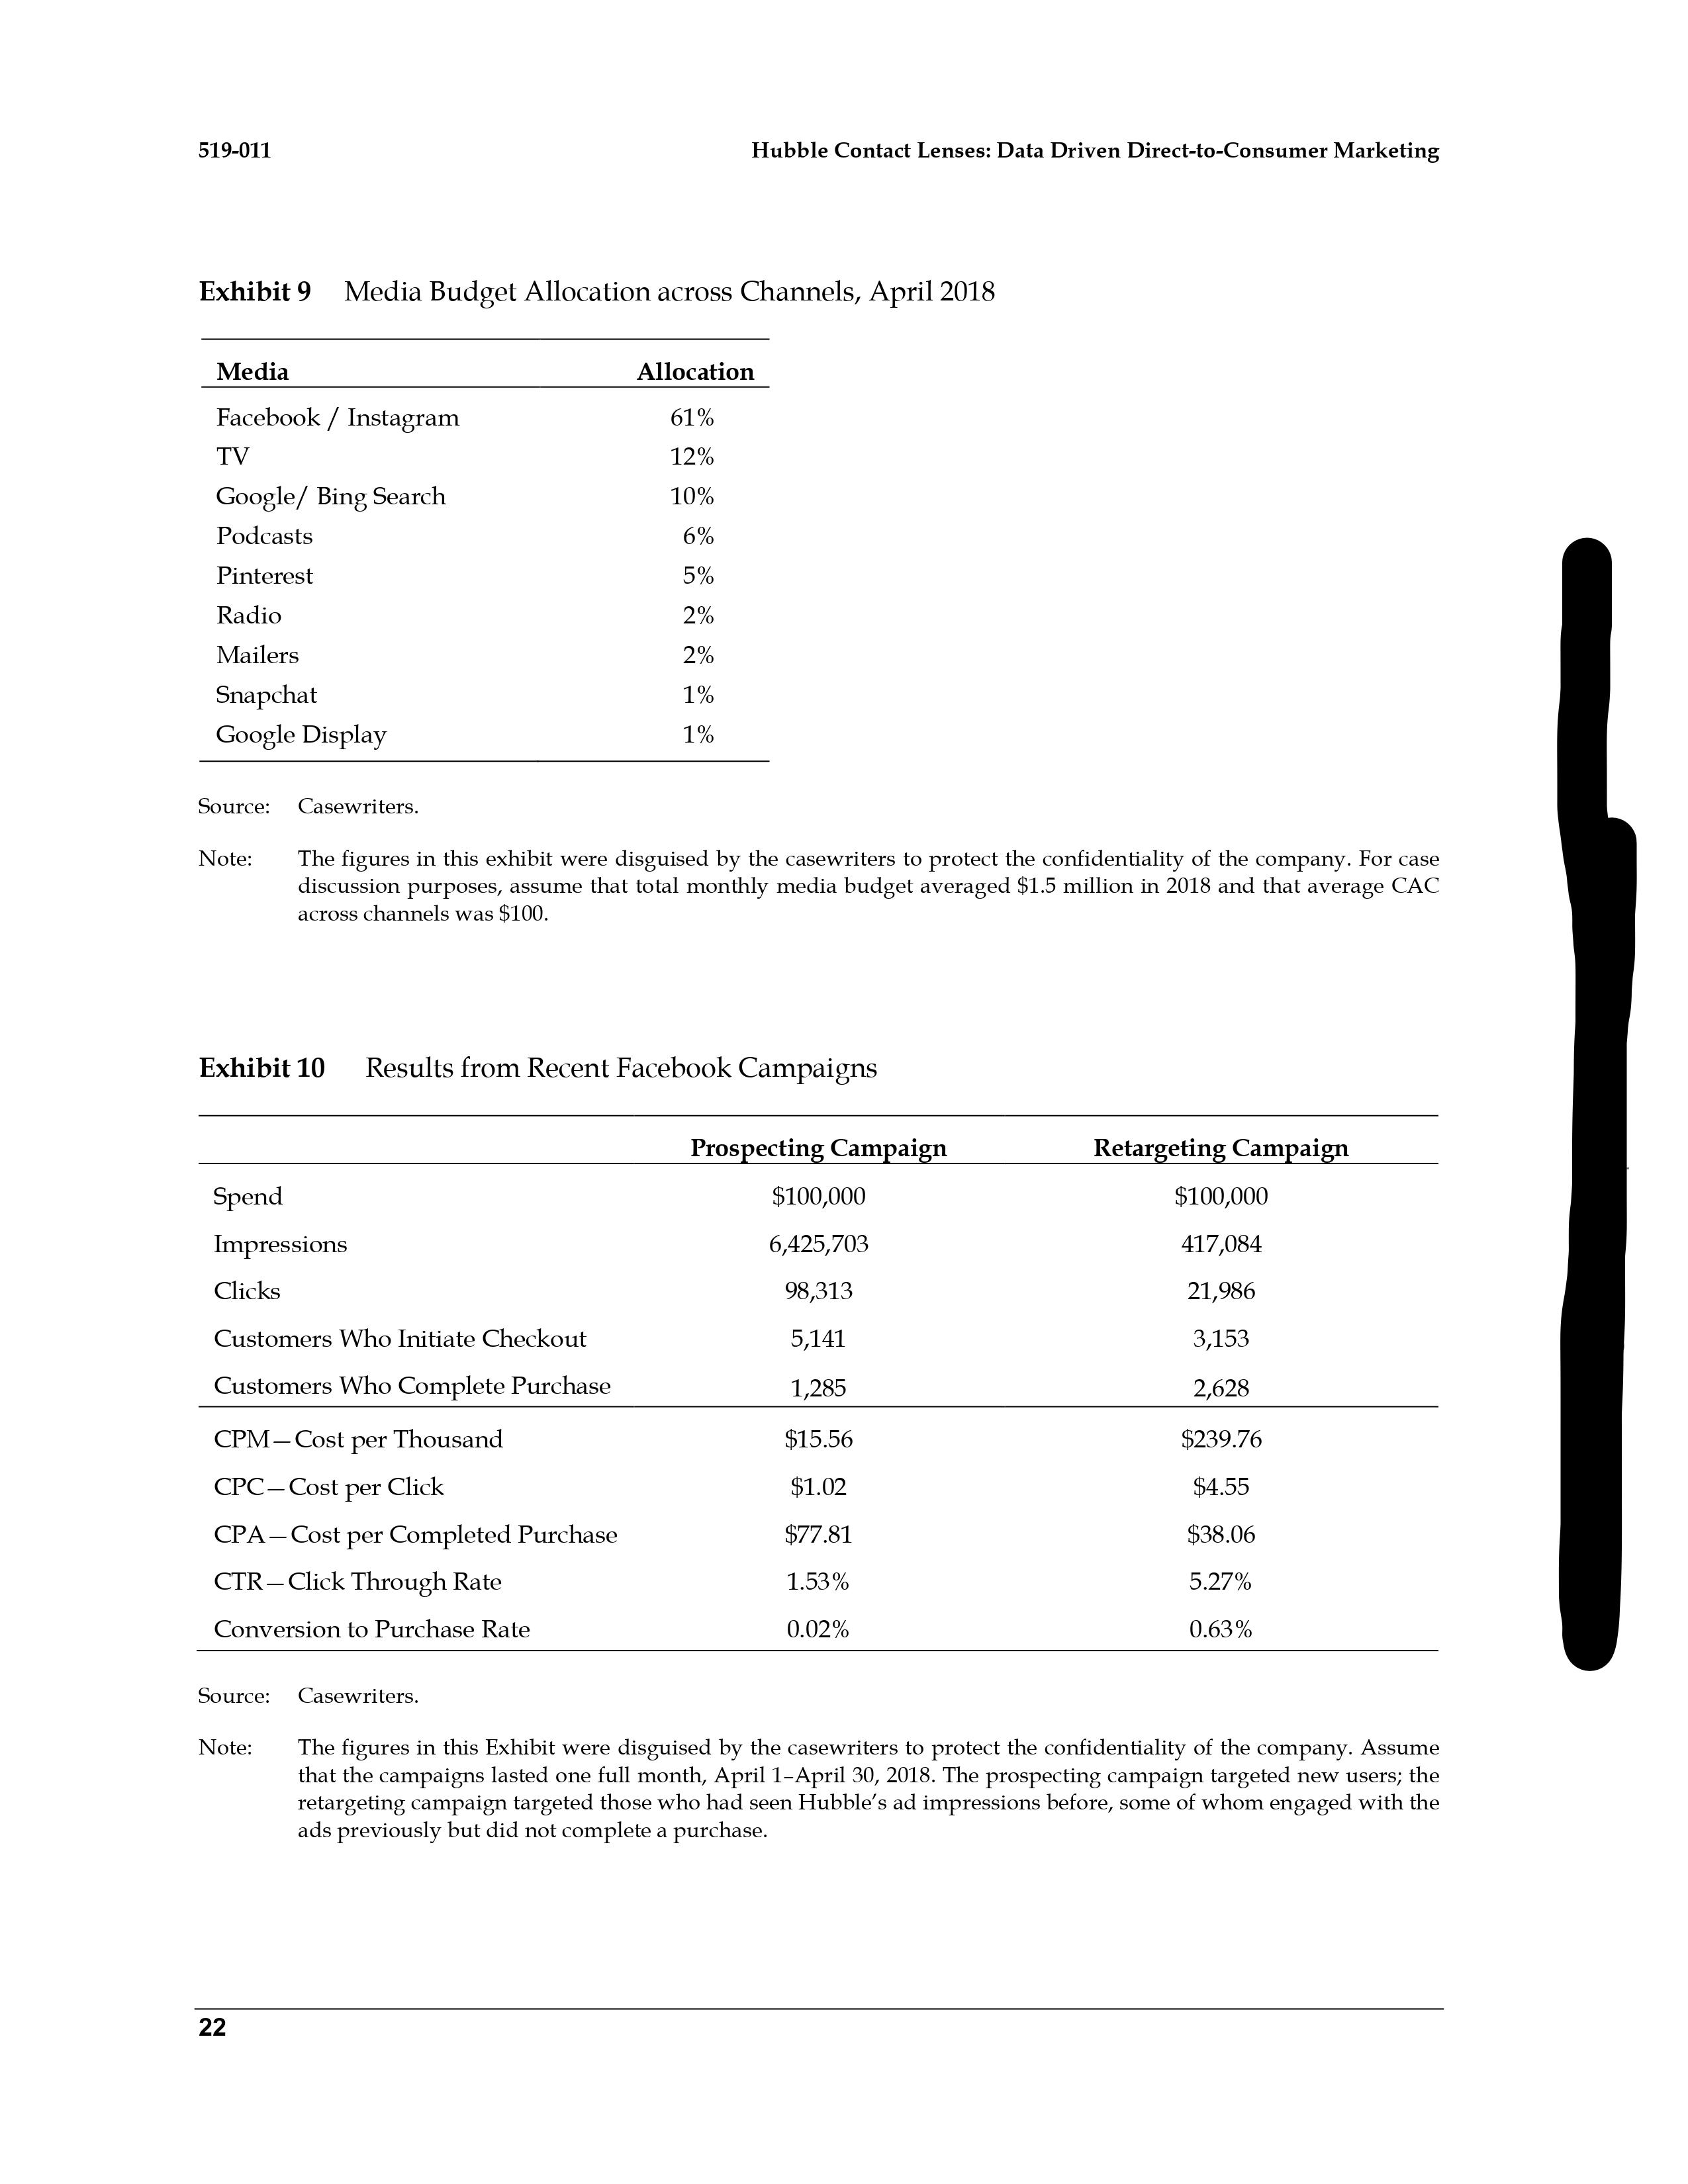
Ref: The case: Hubble Contact Lenses: Data-Driven Direct-to-Consumer Marketing exhibits 10&12 are attached.
519-011 Hubble Contact Lenses: Data Driven Direct-to-Consumer Marketing Exhibit 9 Media Budget Allocation across Channels, April 2018 Media Allocation Facebook / Instagram 61% TV 12% Google/ Bing Search 10% Podcasts 6% Pinterest 5% Radio 2% Mailers 2% Snapchat 1% Google Display 1% Source: Casewriters. Note: The figures in this exhibit were disguised by the casewriters to protect the confidentiality of the company. For case discussion purposes, assume that total monthly media budget averaged $1.5 million in 2018 and that average CAC across channels was $100. Exhibit 10 Results from Recent Facebook Campaigns Prospecting Campaign Retargeting Campaign Spend $100,000 $100,000 Impressions 6,425,703 417,084 Clicks 98,313 21,986 Customers Who Initiate Checkout 5,141 3,153 Customers Who Complete Purchase 1,285 2,628 CPM-Cost per Thousand $15.56 $239.76 CPC-Cost per Click $1.02 $4.55 CPA - Cost per Completed Purchase $77.81 $38.06 CTR -Click Through Rate 1.53% 5.27% Conversion to Purchase Rate 0.02 0.63% Source: Casewriters. Note The figures in this Exhibit were disguised by the casewriters to protect the confidentiality of the company. Assume that the campaigns lasted one full month, April 1-April 30, 2018. The prospecting campaign targeted new users; the retargeting campaign targeted those who had seen Hubble's ad impressions before, some of whom engaged with the ads previously but did not complete a purchase. 22Note: 7/1/2017 7/8/2017 Control Markets Treated Markets 7/15/2017 Source: Company documents. Difference (Treatment minus Control) 7/22/ 2017 7/39/217 8/5/2017 Source: Casewriters, with disguised figures based on company documents. 8/12/2017 8/19/2017 8/26/ 2017 9/ 2/2017 (Acquisitions per 1,000 Customers Exhibit 12 A Comparison between Television Advertising Media Treatment and Control Markets 0.004 0.036 0.032 9/9/2017 Exhibit 11 The Correlation between Television Ad Spending and Hubble's Sales, July 1-December 30, 2017 9/16/2017 Sales (Treated Micte 9/23/ 2017 9/30/ 20 17 Spot TV Spend vs. Sales expected to see 0.044 + 0.004 = 0.048 sales, but we see 0.054. Comparing these figures, the lift in sales in the treated market due to advertising is 12.5%. Sales in the Period before Advertising Sales in the Period after Advertising 10/7/2017 The interpretation is that the ads added 0.006 more acquisition per 1,000 customers in the treated market than what we would expect without ads. This means we would have 10/14/2017 10/21/2017 Spot TV Spend (Acquisitions per 1,000 Customers) 0.044 0.054 0.010 10/28/ 2017 11/4/2017 11/11/2017 11/18/2017 11/3/17 12/2/2017 12/9/2017 12/16/2017 12/23/2017 17/30/2017 519-011 -23
Step by Step Solution
There are 3 Steps involved in it
Step: 1
Get Instant Access to Expert-Tailored Solutions
See step-by-step solutions with expert insights and AI powered tools for academic success
Step: 2
Step: 3
Ace Your Homework with AI
Get the answers you need in no time with our AI-driven, step-by-step assistance