New Semester
Started
Get
50% OFF
Study Help!
--h --m --s
Claim Now
Question Answers
Textbooks
Find textbooks, questions and answers
Oops, something went wrong!
Change your search query and then try again
S
Books
FREE
Study Help
Expert Questions
Accounting
General Management
Mathematics
Finance
Organizational Behaviour
Law
Physics
Operating System
Management Leadership
Sociology
Programming
Marketing
Database
Computer Network
Economics
Textbooks Solutions
Accounting
Managerial Accounting
Management Leadership
Cost Accounting
Statistics
Business Law
Corporate Finance
Finance
Economics
Auditing
Tutors
Online Tutors
Find a Tutor
Hire a Tutor
Become a Tutor
AI Tutor
AI Study Planner
NEW
Sell Books
Search
Search
Sign In
Register
study help
statistics
discovering statistics
Discovering Statistics Using IBM SPSS Statistics 6th Edition Andy Field - Solutions
What effect does accounting for the participant’s sex have on the relationship between the time spent shopping and the distance covered?
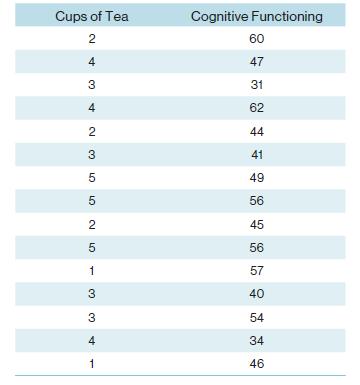
In Chapter 8 (Task 9) we looked at data based on findings that the number of cups of tea drunk was related to cognitive functioning (Feng et al., 2010). Using a linear model that predicts cognitive functioning from tea drinking, what would cognitive functioning be if someone drank 10 cups of tea?
Estimate a linear model for the pubs.sav data in Jane Superbrain Box 9.1 predicting mortality from the number of pubs. Try repeating the analysis but bootstrapping the confidence intervals.
In Jane Superbrain Box 2.1 we encountered data (honesty_lab.sav) relating to people’s ratings of dishonest acts and the likeableness of the perpetrator. Run a linear model with bootstrapping to predict ratings of dishonesty from the likeableness of the perpetrator.
A fashion student was interested in factors that predicted the salaries of catwalk models. She collected data from 231 models (supermodel.sav). For each model she asked them their salary per day (salary), their age (age), their length of experience as models (years) and their industry status as a
A study was carried out to explore the relationship between aggression and several potential predicting factors in 666 children who had an older sibling. Variables measured were parenting_style (high score = bad parenting practices), computer_games (high score = more time spent playing computer
Repeat the analysis in Labcoat Leni’s Real Research 9.1 using bootstrapping for the confidence intervals. What are the confidence intervals for the regression parameters?
Coldwell et al. (2006) investigated whether household chaos predicted children’s problem behaviour over and above parenting. From 118 families they recorded the age and gender of the youngest child (child_age and child_ gender). They measured dimensions of the child’s perceived relationship
Is arachnophobia (fear of spiders) specific to real spiders or will pictures of spiders evoke similar levels of anxiety? Twelve arachnophobes were asked to play with a big hairy tarantula with big fangs and an evil look in its eight eyes and at a different point in time were shown only pictures of
Plot an error bar graph of the data in Task 1 (remember to adjust for the fact that the data are from a repeated measures design.)Task 1Is arachnophobia (fear of spiders) specific to real spiders or will pictures of spiders evoke similar levels of anxiety? Twelve arachnophobes were asked to play
Pop psychology’ books sometimes spout nonsense that is unsubstantiated by science. As part of my plan to rid the world of pop psychology I took 20 people in relationships and randomly assigned them to one of two groups. One group read the famous popular psychology book Women are from Bras and Men
Twaddle and Sons, the publishers of Women are from Bras and Men are from Penis, were upset about my claims that their book was as useful as a paper umbrella. They ran their own experiment (N = 500) in which relationship happiness was measured after participants had read their book and after reading
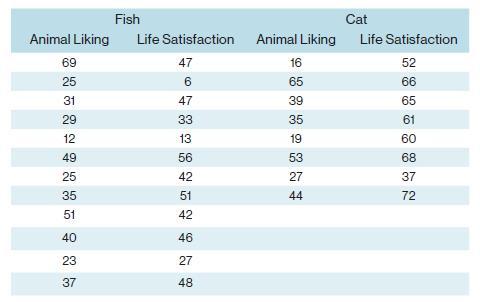
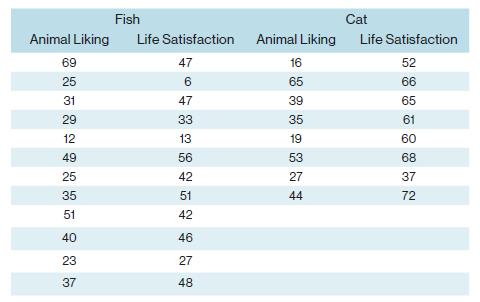
In Chapter 4 (Task 6) we looked at data from people who had fish or cats as pets and measured their life satisfaction as well as how much they like animals (pets.sav). Conduct a t-test to see whether life satisfaction depends upon the type of pet a person has.Chapter 4 Task 6I wondered whether a
Fit a linear model to the data in Task 5 to see whether life satisfaction is significantly predicted from the type of animal. What do you notice about the t-value and significance in this model compared to Task 5.Task 5In Chapter 4 (Task 6) we looked at data from people who had fish or cats as pets
Analyse the data in Chapter 6, Task 1 (whether men and dogs differ in their doglike behaviours) using an independent t-test with bootstrapping. Do you reach the same conclusions (men_dogs.sav)?Chapter 6 Task 1Using the notebook.sav data from Chapter 5, check the assumptions of normality and
Analyse the data in Chapter 6, Task 2 (whether the type of music you hear influences goat sacrificing – dark_lord.sav), using a paired-samples t-test with bootstrapping. Do you reach the same conclusions? Chapter 6 Task 2The file spss_exam.sav contains data on students’ performance on an SPSS
Produce the simple slopes analysis for Task 1.Task 1McNulty et al. (2008) found a relationship between a person’s attractiveness and how much support they give their partner among newlywed heterosexual couples. The data are in mcnulty_2008.sav, Is this relationship moderated by spousen (i.e.,
McNulty et al. (2008) also found a relationship between a person’s attractiveness and their relationship satisfaction among newlyweds. Using the same data as in Tasks 1 and 2, find out if this relationship is moderated by spouse.Task 1McNulty et al. (2008) found a relationship between a
In this chapter we tested a mediation model of infidelity for Lambert et al.’s data. Repeat this analysis but using hook_ups as the measure of infidelity.
Tablets like the iPad are very popular. A company owner was interested in how to make his brand of tablets more desirable. He collected data on how cool people perceived a product’s advertising to be (advert_cool), how cool they thought the product was (product_cool) and how desirable they found
What are (broadly speaking) the five stages of the research process?
What is the level of measurement of the following variables? The number of downloads of different bands’ songs on iTunesThe names of the bands that were downloadedTheir positions in the download chartThe money earned by the bands from the downloadsThe weight of drugs bought by the bands with
Say I own 857 CDs. My friend has written a computer program that uses a webcam to scan the shelves in my house where I keep my CDs and measure how many I have. His program says that I have 863 CDs. Define measurement error. What is the measurement error in my friend’s CD-counting device?
Sketch the shape of a normal distribution, a positively skewed distribution and a negatively skewed distribution.
In 2011 I got married and we went to Disney World in Florida for our honeymoon. We bought some bride and groom Mickey Mouse hats and wore them around the parks. The staff at Disney are really nice and upon seeing our hats would say ‘congratulations’ to us. We counted how many times people said
In this chapter we used an example of the time taken for 21 heavy smokers to fall off a treadmill at the fastest setting (18, 16, 18, 24, 23, 22, 22, 23, 26, 29, 32, 34, 34, 36, 36, 43, 42, 49, 46, 46, 57). Calculate the sum of squares, variance and standard deviation of these data.
Sports scientists sometimes talk of a ‘red zone’, which is a period during which players in a team are more likely to pick up injuries because they are fatigued. When a player hits the red zone it is a good idea to rest them for a game or two. At a prominent London football club that I support,
Celebrities always seem to be getting divorced. The (approximate) lengths of some celebrity marriages in days are: 240 (J-Lo and Cris Judd), 144 (Charlie Sheen and Donna Peele), 143 (Pamela Anderson and Kid Rock), 72 (Kim Kardashian, if you can call her a celebrity), 30 (Drew Barrymore and Jeremy
Repeat Question 9 but excluding Jennifer Anniston and Brad Pitt’s marriage. How does this affect the mean, median, range, interquartile range, and standard deviation? What do the differences in values between Tasks 9 and 10 tell us about the influence of unusual scores on these measures?Data From
What is the mean and how do we tell if it’s representative of our data?
What do the sum of squares, variance and standard deviation represent? How do they differ?
What is a test statistic and what does it tell us?
What is statistical power?
Figure 2.21 shows two experiments that looked at the effect of singing versus conversation on how much time a woman would spend with a man. In both experiments the means were 10 (singing) and 12 (conversation), the standard deviations in all groups were 3, but the group sizes were 10 per group in
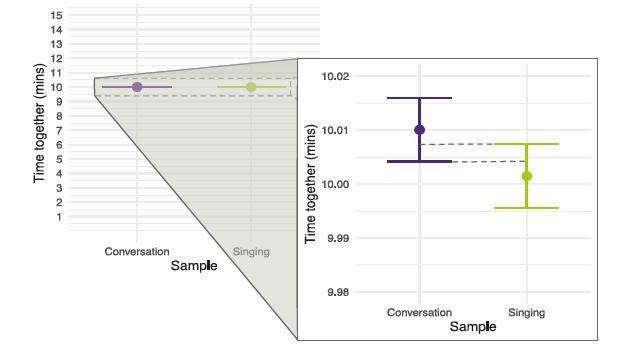
Figure 2.22 shows a similar study to that in Task 9, but the means were 10 (singing) and 10.01 (conversation), the standard deviations in both groups were 3 and each group contained 1 million people. Compute the values of the confidence intervals displayed in the figure. Time together (mins) 5 4 3
In Chapter 1 (Question 8) we looked at an example of how many games it took a sportsperson before they hit the ‘red zone’ Calculate the standard error and confidence interval for those data.Data From Question 8 Chapter 1Sports scientists sometimes talk of a ‘red zone’, which is a period
At a rival club to the one I support, they similarly measured the number of consecutive games it took their players before they reached the red zone. The data are: 6, 17, 7, 3, 8, 9, 4, 13, 11, 14, 7. Calculate the mean, standard deviation and confidence interval for these data.
In Chapter 1 (Question 9) we looked at the length in days of 11 celebrity marriages. Here are the approximate lengths in months of nine marriages, one being mine and the others being those of some of my friends and family. In all but two cases the lengths are calculated up to the day I’m writing
What is an effect size and how is it measured?
In Chapter 1 (Task 8) we looked at an example of how many games it took a sportsperson before they hit the ‘red zone’, then in Chapter 2 we looked at data from a rival club. Compute and interpret Cohen’s d for the difference in the mean number of games it took players to become fatigued in
Calculate and interpret Cohen’s d for the difference in the mean duration of the celebrity marriages in Chapter 1 (Question 9) and mine and my friends’ marriages in Chapter 2 (Question 13).Chapter 1 Question 9Celebrities always seem to be getting divorced. The (approximate) lengths of some
What are the problems with null hypothesis significance testing?
What is meta-analysis?
Describe what you understand by the term ‘Bayes factor’.
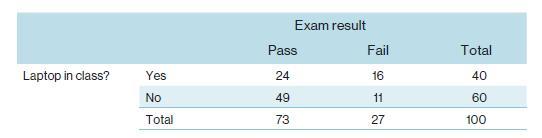
Various studies have shown that students who use laptops in class often do worse on their modules (Payne-Carter et al., 2016; Sana et al., 2013). Table 3.3 shows some fabricated data that mimic what has been found. What is the odds ratio for passing the exam if the student uses a laptop in class
From the data in Table 3.3, what is the conditional probability that someone used a laptop in class given that they passed the exam, p(laptop|pass). What is the conditional probability of that someone didn’t use a laptop in class given they passed the exam, p(no laptop |pass)? Laptop in class?
Using the data in Table 3.3, what are the posterior odds of someone using a laptop in class (compared to not using one) given that they passed the exam? Exam result Pass Fail Total Laptop in class? Yes 24 16 40 No 49 11 60 Total 73 27 100
Smart Alex’s first task for this chapter is to save the data that you’ve entered in this chapter. Save it somewhere on the hard drive of your computer or the cloud. Give it a sensible title and save it somewhere easy to find (perhaps create a folder called ‘My Data Files’ where you can save
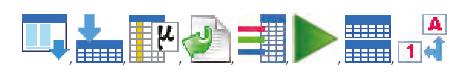
What are the following icons shortcuts to? 1 A
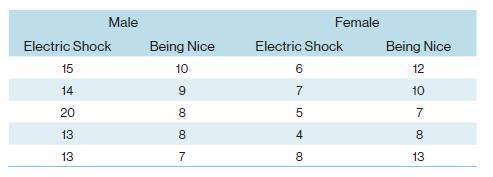
The data below show the score (out of 20) for 20 different students, some of whom are male and some female, and some of whom were taught using positive reinforcement (being nice) and others who were taught using punishment (electric shock). Enter these data into SPSS and save the file as
Thinking back to Labcoat Leni’s Real Research 4.1, Oxoby also measured the minimum acceptable offer; these MAOs (in dollars) are below (again, they are approximations based on the graphs in the paper). Enter these data into the SPSS data editor and save this file as acdc.sav.Bon Scott group: 2,
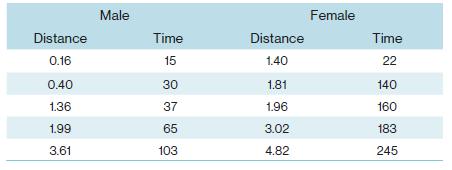
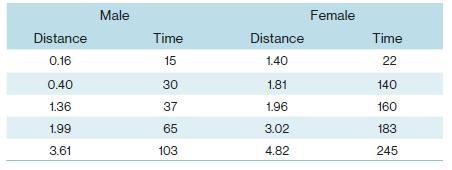
According to some highly unscientific research done by a UK department store chain and reported in Marie Claire magazine (https://tinyurl.com/mcsgh), shopping is good for you. They found that the average woman spends 150 minutes and walks 2.6 miles when she shops, burning off around 385 calories.
I wondered whether a fish or cat made a better pet. I found some people who had either fish or cats as pets and measured their life satisfaction and how much they like animals. Enter these data into SPSS and save as pets.sav. Fish Cat Animal Liking Life Satisfaction Animal Liking Life Satisfaction
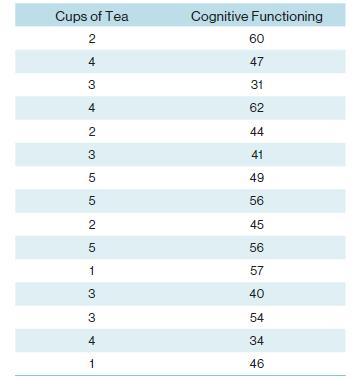
One of my favourite activities, especially when trying to do brain-melting things like writing statistics books, is drinking tea. I am English, after all. Fortunately, tea improves your cognitive function – well, it does in older Chinese people at any rate (Feng et al., 2010). I may not be
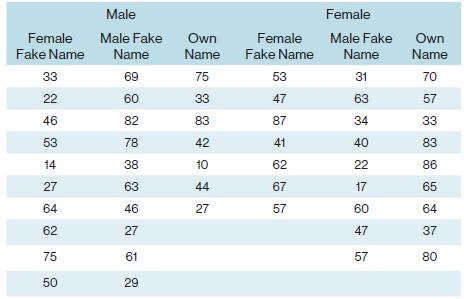
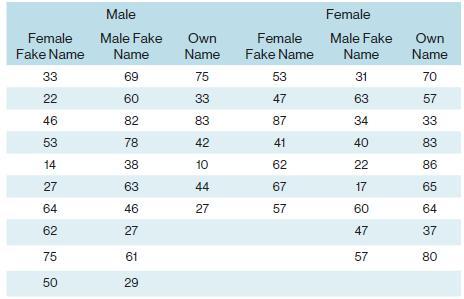
Statistics and maths anxiety are common and affect people’s performance on maths and stats assignments; women in particular can lack confidence in mathematics (Field, 2010, 2014). Zhang et al. (2013) did an intriguing study in which students completed a maths test and some put their own name on
What is a coding variable?
What is the difference between wide and long format data?
Using the same data, plot and interpret an error bar chart showing the mean alcohol consumption for students and lecturers.
Using the same data, plot and interpret an error line chart showing the mean income for students and lecturers.
Using the same data, plot and interpret error a line chart showing the mean neuroticism for students and lecturers.
Using the same data, plot and interpret a scatterplot with regression lines of alcohol consumption and neuroticism grouped by lecturer/student.
Using the same data, plot and interpret a scatterplot matrix with regression lines of alcohol consumption, neuroticism and number of friends.
Using the zhang_sample.sav data from Chapter 4 (Task 8) plot a clustered error bar chart of the mean test accuracy as a function of the type of name participants completed the test under (x-axis) and whether they identified as male or female (different coloured bars). Chapter 4 Task 8 were given
Using the teach_method.sav data from Chapter 4 (Task 3), plot a clustered error line chart of the mean score when electric shocks were used compared to being nice, and plot males and females as different coloured lines.Chapter 4 Task 3The data below show the score (out of 20) for 20 different
Using the shopping.sav data from Chapter 4 (Task 5), plot two error bar charts comparing men and women (x-axis): one for the distance walked, and the other for the time spent shopping.Chapter 4 Task 5According to some highly unscientific research done by a UK department store chain and reported in
Using the pets.sav data from Chapter 4 (Task 6), plot two error bar charts comparing scores when having a fish or cat as a pet (x-axis): one for the animal liking variable and the other for the life satisfaction.Chapter 4 Task 6I wondered whether a fish or cat made a better pet. I found some people
Using the same data as above, plot a scatterplot of animal liking scores against life satisfaction (plot scores for those with fishes and cats in different colours).
Using the tea_15.sav data from Chapter 4 (Task 7), plot a scatterplot showing the number of cups of tea drunk (x-axis) against cognitive functioning (y-axis).Chapter 4 Task 7One of my favourite activities, especially when trying to do brain-melting things like writing statistics books, is drinking
Using the notebook.sav data from Chapter 5, check the assumptions of normality and homogeneity of variance for the two films (ignore sex). Are the assumptions met?
The file spss_exam.sav contains data on students’ performance on an SPSS exam. Four variables were measured: exam (first-year SPSS exam scores as a percentage), computer (measure of computer literacy as a percentage), lecture (percentage of SPSS lectures attended) and numeracy (a measure of
Calculate and interpret the z-scores for skewness for all variables.
Calculate and interpret the z-scores for kurtosis for all variables.
Use the split file command to look at and interpret the descriptive statistics for numeracy and exam.
Repeat Task 5 but for the computer literacy and percentage of lectures attended.
Conduct and interpret a K-S test for numeracy and exam.
Conduct and interpret a Levene’s test for numeracy and exam.
Transform the numeracy scores (which are positively skewed) using one of the transformations described in this chapter. Do the data become normal?
Use the explore command to see what effect a natural log transformation would have on the four variables measured in spss_exam.sav.
Showing 100 - 200
of 178
1
2
Step by Step Answers