All Matches
Solution Library
Expert Answer
Textbooks
Search Textbook questions, tutors and Books
Oops, something went wrong!
Change your search query and then try again
Toggle navigation
FREE Trial
S
Books
FREE
Tutors
Study Help
Expert Questions
Accounting
General Management
Mathematics
Finance
Organizational Behaviour
Law
Physics
Operating System
Management Leadership
Sociology
Programming
Marketing
Database
Computer Network
Economics
Textbooks Solutions
Accounting
Managerial Accounting
Management Leadership
Cost Accounting
Statistics
Business Law
Corporate Finance
Finance
Economics
Auditing
Hire a Tutor
AI Study Help
New
Search
Search
Sign In
Register
study help
mathematics
econometric
Questions and Answers of
Econometric
What would you do if you had to choose between a model that satisfies all statistical criteria but does not satisfy economic theory and a model that fits established economic theory but does not fit
Table 7-5, found on the textbook's Web site, gives data on the real gross product, labor input, and real capital input in the Taiwanese manufacturing sector for the years 1958 to 1972. Suppose the
Consider the following models: Model I: Consumption i = B1 + B2 income i + ui Model II: Consumption i = A1 + A2 wealth i + vi a. How would you decide which of the models is the "true" model? b.
Refer to Equation 5.40 which discusses the regression-through-the-origin (i.e., zero-intercept) model. If there is in fact an intercept present in the model but you run it through the origin, what
Table 7-6 (found on the textbook's Web site) gives data on the real rate of return (Y) on common stocks, the output growth (X2), and inflation (X3), all in percent for the United States for 1954 to
Table 7-7 (found on the textbook's Web site) gives data on indexes of aggregate final energy demand (Y), the real gross domestic product, the GDP (X2), and the real energy price (X3) for the OECD
Refer to Problem 7.11. Suppose you extend the Cobb-Douglas production function model by including the trend variable X4, a surrogate for technology. Suppose further that X4 turns out to be
Table 7-8 on the textbook's Web site gives data on variables that might affect the demand for chickens in the United States. The dependent variable here is the per capita consumption of chickens, and
Suppose that we modify model (7.13) as follows:Yt = B1 + B2Xt + B3Time + B4Time2 + uta. Estimate this model.b. If the Year2in this model turns out to be statistically significant, what can you say
Does more money help schools? To answer this question, Ruben Hernandez-Murillo and Deborah Roisman present the data given in Table 7-9 on the textbook's Web site.These data relate to several input
What are the reasons for the occurrence of specification errors?
In Bazemore v. Friday, 478 U.S. 385 (1986), a case involving pay discrimination in the North Carolina Extension Service, the plaintiff, a group of black agents, submitted a multiple regression model
Table 7-10 on the textbook's Web site contains data about the manufacturing sector of all 50 states and the District of Columbia. The dependent variable is output, measured as "value added" in
What are the attributes of a "good" econometric model?
What are the consequences of omitting a relevant variable(s) from a model?
When we say that a variable is "relevant" or "irrelevant," what do we mean?
Omitting a relevant variable(s) from a model is more dangerous than including an irrelevant variable(s). Do you agree? Why or why not?
In looking for the simple Keynesian multiplier, you regress the GNP on in-vestment and find that there is some relationship. Now, thinking that it cannot hurt much, you include the "irrelevant"
State with reasons whether the following statements are true or false: a. Despite perfect multicollinearity, OLS estimators are best linear unbiased estimators (BLUE). b. In cases of high
In data involving economic time series such as unemployment, money supply, interest rate, or consumption expenditure, multicollinearity is usually suspected. Why?
Consider the following model: Yt = B1 + B2Xt + B3Xt - 1 + B4Xt - 2 + B3Xt - 3 + ut where Y = the consumption X = the income t = the time This model states that consumption expenditure at time Ms a
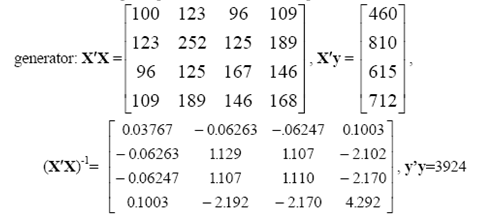
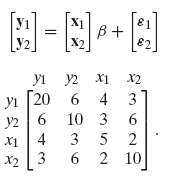
Consider the following set of hypothetical data:Suppose you want to do a multiple regression of Y on X2 and X3.a. Can you estimate the parameters of this model? Why or why not?b. If not, which
You are given the annual data in Table 8-5 for the United States for the period 1971 to 1986. Consider the following aggregate demand function for passenger cars:InYi = B1 + B2InX2t + B3InX3t +
Continue with Problem 8.14. Is there multicollinearity in the previous problem? How do you know?Problem 8.14You are given the annual data in Table 8-5 for the United States for the period 1971 to
If there is collinearity in Problem 8.14, estimate the various auxiliary regressions and find out which of the X variables are highly collinear.Problem 8.14You are given the annual data in Table 8-5
Continuing with the preceding problem, if there is severe collinearity, which variable would you drop and why? If you drop one or more X variables, what type of error are you likely to commit?
After eliminating one or more X variables, what is your final demand function for passenger cars? In what ways is this "final" model better than the initial model that includes all X variables?
What other variables do you think might better explain the demand for auto-mobiles in the United States?
In a study of the production function of the United Kingdom bricks, pottery, glass, and cement industry for the period 1961 to 1981, R. Leighton Thomas obtained the following results: 1. log Q = -
Establish Eqs. (8.12) and (8.13).
You are given the hypothetical data in Table 8-6 on weekly consumption expenditure (Y), weekly income (X2), and wealth (X3), all in dollars.a. Do an OLS regression of Y on X2 and X3.b. Is there
Utilizing the data given in Table 8-1, estimate Eq. (8.20) and compare your results.
Check that all R2 values in Table 8-4 are statistically significant.
Refer to Problem 7.19 and the data given in Table 7-9. How would your answer to this problem change knowing what you now know about multicollinearity? Present the necessary regression results.
Refer to Problem 2.16. Suppose you regress ASP on GPA, GMAT, acceptance rate (%), tuition, and recruiter rating. A priori, would you face the multicollinearity problem? If so, how would you resolve
Based on the quarterly data for the U.K. for the period 1990-1Q to 1998-2Q, the following results were obtained by Asteriou and Hall. The dependent variable in these regressions is Log(IM) =
Table 8-7 on the textbook's Web site gives data on imports, GDP, and the Consumer Price Index (CPI) for the United States over the period 1975-2005.You are asked to consider the following model:In
Table 8-8 on the textbook's Web site gives data on new passenger cars sold in the United States as a function of several variables.a. Develop a suitable linear or log-linear model to estimate a
You include the subject's height, measured in inches, and the same subject's height measured in feet in a regression of weight on height. Explain intuitively why ordinary least squares (OLS) cannot
As cheese ages, several chemical processes take place that determine the taste of the final product. Table 8-9 on the textbook's Web site contains data on the concentrations of various chemicals in
Table 8-10 on the textbook's Web site gives data on the average salary of top managers (in thousands of Dutch guilders), profit (in millions of Dutch guilders), and turnover (in millions of Dutch
Consider the model Yi = B1 + B2Xi + B3X2i + B4X3i + ui where Y = the total cost of production and X = the output. Since X2 and X3 are functions of X, there is perfect collinearity. Do you agree? Why
Refer to Equations (4.21), (4.22), (4.25), and (4.27). Let x3i = 2x2i. Show why it is impossible to estimate these equations.
What are the practical consequences of imperfect multicollinearity?
What is meant by the variance inflation factor (VIF)? From the formula (8.14), can you tell the least possible and the highest possible value of the VIF?
What is meant by heteroscedasticity? What are its effects on the following? a. Ordinary least squares (OLS) estimators and their variances. b. Confidence intervals. c. The use of t and F tests of
Continue with the wage data given in Table 9-2 (found on the textbook's Web site) and now consider the following regressions:wagei = A1 + A2 experiencei + uiIn wagei =B1 + B2 In experiencei + uia.
Consider Figure 9-10, which plots the gross domestic product (GDP) growth, in percent, against the ratio of investment/GDP, in percent, for several countries for 1974 to 1985.28 The various countries
In a survey of 9,966 economists in 1964 the following data were obtained:a. Develop a suitable regression model to explain median salary in relation to age. For the purpose of regression, assume that
Spearman's rank correlation test for heteroscedasticity. The following steps are involved in this test, which can be explained with the wage regression (9.3):a. From the regression (9.3), obtain the
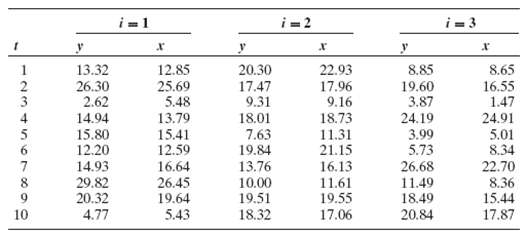
Weighted least squares. Consider the data in Table 9-4. a. Estimate the OLS regressionYi = B1 + B2Xi + uib. Estimate the WLS(Make sure that you run the WLS through the origin.) Compare the results of
Show that the error term vi in Eq. (9.27) is homoscedastic.
In a regression of average wages (W) on the number of employees (N) for a random sample of 30 firms, the following regression results were obtaineda. How would you interpret the two regressions? b.
From the total cost function given in the NYSE regression (9.31), how would you derive the average cost function? And the marginal cost function? But if Eq. (9.32) is the true (i.e.,
Table 9-5, on the textbook's Web site, gives data on five socioeconomic indicators for a sample of 20 countries, divided into four per-capita income categories: low-income (up to $500 per year),
The model from Ex. 9.18, without inclusion of X4 and X5, when tested for het- eroscedasticity following the White test outlined in regression (9.14), yielded the following regression results. To save
State with brief reasons whether the following statements are true or false: a. In the presence of heteroscedasticity OLS estimators are biased as well as inefficient. b. If heteroscedasticity is
a. Use the data given in Table 9-5 (on the textbook's Web site) to develop amultiple regression model to explain daily calorie intake for the 20 countries shown in the table.b. Does this model suffer
For the models considered in Table 7-1, find out if these models suffer from the problem of heteroscedasticity. The raw data are given in Table 9-6, found on the textbook's Web site. State the tests
Estimate the counterparts of Equations (9.10) to (9.12) using Exper and Wagef as the deflators.
Describe the Breusch-Pagan (BP) test. Verify that, on the basis of this test, Eq. (9.33) shows no evidence of heteroscedasticity.
Interpret the dummy coefficients in Eq. (9.33).
a. Create a standard LIV (linear-in-variables) regression model and note the results.b. Using the software package of your choice, obtain White's heteroscedasticity-corrected regression results. What
Table 9-8 (found on the textbook's Web site) gives data on salary and related data on 447 executives of Fortune 500 companies. Salary = 1999 salary and bonuses; tot-comp = 1999 CEO total
Table 9-9 (on the textbook's Web site) gives data on 81 cars regarding MPG (average miles per gallon), HP (engine horsepower), VOL (cubic feet of cab space), SP (top speed, miles per hour), and WT
Would you expect heteroscedasticity to be present in the following regressions?
Explain briefly the logic behind the following methods of detecting heteroscedasticity: a. The graphical method b. The Park test c. The Glejser test
In the two-variable population regression function (PRF), suppose the error variance has the following structure: E(u2i) = σ2X4i How would you transform the model to achieve homoscedastic error
Consider the following two regressions based on the U.S. data for 1946 to 1975.26 (Standard errors are in parentheses.)where C = aggregate private consumption expenditure GNP = gross national
In a study of population density as a function of distance from the central business district, Maddala obtained the following regression results based on a sample of 39 census tracts in the Baltimore
Refer to the wage data given in Table 9-2 (found on the textbook's Web site). Regression (9.30) gives the results of the regression of the log of wage on the log of education. a. Based on the data of
Explain briefly the meaning of a. Autocorrelation b. First-order autocorrelation c. Spatial correlation
Complete the following table:
Use the runs test to test for autocorrelation in the following cases. (Use the Swed-Eisenhart tables. See Appendix 10A.)
For the Phillips curve regression Equation (5.29) given in Chapter 5, the estimated d statistic would be 0.6394.a. Is there evidence of first-order autocorrelation in the residuals? If so, is it
In studying the movement in the production workers' share in value added (i.e., labor's share) in manufacturing industries, the following regression results were obtained based on the U.S. data for
Durbin's two-step method of estimating ρ Write the generalized difference equation (10.14) in a slightly different but equivalent form as follows: Yt = B1(l - ρ) + B2Xt - ρB2Xt-1 + ρYt-1 + vt In
Consider the following regression model: Ŷt = - 49.4664 + 0.88544X2t + 0.09253X3t; R2 = 0.9979; d = 0.8755 t = (- 2.2392) (70.2936) (2.6933) where Y = the personal consumption expenditure (1982
Durbin h statistic. In autoregressive models like Eq. (10.7):Yt = B1 + B2Xt + B3Yt-1 + vtthe usual d statistic is not applicable to detect autocorrelation. For such models, Durbin has suggested
Consider the data given in Table 10-7 (on the textbook's Web site) relating to stock prices and GDP for the period 1980-2006.a. Estimate the OLS regressionYt = B1 + B2Xt + utb. Find out if there is
Consider the following model: Yt = B1 + B2X2t B3X3t + B4X4t + ut Suppose the error term follows the AR(1) scheme in Eq. (10.6). How would you transform this model so that there is no autocorrelation
Establish Eq. (10.8).
What is the importance of assuming the Markov first-order, or AR(1), auto-correlation scheme?
The Theil-Nagar p based on d statistic. Theil and Nagar have suggested that in small samples instead of estimating p as (1 - d/2), it should be estimated aswhere n = the sample size d = the
Refer to Example 7.3 relating expenditure on imports (Y) to personal disposable income (X). Now consider the following models:a. What do these results suggest about the nature of autocorrelation in
Assuming the AR(1) scheme, what are the consequences of the CLRM assumption that the error terms in the PRF are uncorrelated?
In the presence of AR(1) autocorrelation, what is the method of estimation that will produce BLUE estimators? Outline the steps involved in implementing this method.
What are the various methods of estimating the autocorrelation parameter p in the AR(1) scheme?
What are the various methods of detecting autocorrelation? State clearly the assumptions underlying each method.
Although popularly used, what are some limitations of the Durbin-Watson d statistic?
State whether the following statements are true or false. Briefly justify your answers. a. When autocorrelation is present, OLS estimators are biased as well as inefficient. b. The Durbin-Watson d is
What is meant by the simultaneity problem?
What may be meant by the statement that the order condition of identification is a necessary but not sufficient condition for identification?
Explain carefully the meaning of (1) Under identification, (2) Exact identification, and (3) Over identification.
Consider the following two-equation model: Y1t = A1 + A2Y2t + A3X1t + ult Y2t = B1 + B2Y1t + B3X2t + u2t where the Y's are the endogenous variables, the X's the exogenous variables, and the u's the
Consider the following model: Y1t= A1 + A2Y2t + A3X1t + u1t Y2t = B1 + B2Y1t + u2t where the Y's are the endogenous variables, the X's the exogenous, and the u's the stochastic error terms. Based on
Consider the following model: Rt = A1 + A2Mt + A3Yt + u1t Yt = B1 + B2Rt + u2t where Y = income (measured by gross domestic product, GDP), R = interest rate (measured by 6-month Treasury bill rate,
Consider the following reformulation of the model given in Problem 11.18. Rt = A1 + A2Mt + A3Yt + u1t Yt = B1 + B2Rt + B31t + u2t where in addition to the variables defined in the preceding problem,
Wage = $, per hour; Occup = Occupation; Sector = 1 for manufacturing, 2 for construction, 0 for other; Union = 1 if union member, 0 otherwise; Education = years of schooling; Experience = work
What happens if OLS is applied to estimate an equation in a simultaneous equation model?
Showing 300 - 400
of 833
1
2
3
4
5
6
7
8
9