All Matches
Solution Library
Expert Answer
Textbooks
Search Textbook questions, tutors and Books
Oops, something went wrong!
Change your search query and then try again
Toggle navigation
FREE Trial
S
Books
FREE
Tutors
Study Help
Expert Questions
Accounting
General Management
Mathematics
Finance
Organizational Behaviour
Law
Physics
Operating System
Management Leadership
Sociology
Programming
Marketing
Database
Computer Network
Economics
Textbooks Solutions
Accounting
Managerial Accounting
Management Leadership
Cost Accounting
Statistics
Business Law
Corporate Finance
Finance
Economics
Auditing
Hire a Tutor
AI Study Help
New
Search
Search
Sign In
Register
study help
mathematics
econometric
Questions and Answers of
Econometric
Prove that in the model y1 = X1β1 + ε1, y2 = X2β2 + ε2, generalized least squares is equivalent to equation-by-equation ordinary least squares if X1 = X2. Does your result hold if it is also
Consider the two-equation system y1 = β1x1 + ε1, y2 = β2x2 + β3x3 + ε2. Assume that the disturbance variances and covariance are known. Now suppose that the analyst of this model applies GLS but
Consider the system y1 = α1 + βx + ε1, y2 = α2 + ε2. The disturbances are freely correlated. Prove that GLS applied to the system leads to the OLS estimates of α1 and α2 but to a mixture of
For the model y1 = α1 + βx + ε1, y2 = α2 + ε2, y3 = α3 + ε3, assume that yi2 + yi3 = 1 at every observation. Prove that the sample covariance matrix of the least squares residuals from the
Continuing the analysis of Section 14.3.2, we find that a trans log cost function for one output and three factor inputs that does not impose constant returns to scale isln C = α + β1 ln p1 + β2
Consider the following two-equation model: y1 = γ1y2 + β11x1 + β21x2 + β31x3 + ε1, y2 = γ2y1 + β12x1 + β22x2 + β32x3 + ε2.a. Verify that, as stated, neither equation is identified.b.
Verify the rank and order conditions for identification of the second and third behavioral equations in Klein’s Model I.
Check the identifiability of the parameters of the followingmodel:
Obtain the reduced form for the model in Exercise 1 under each of the assumptions made in parts a and in parts b1 and b9.
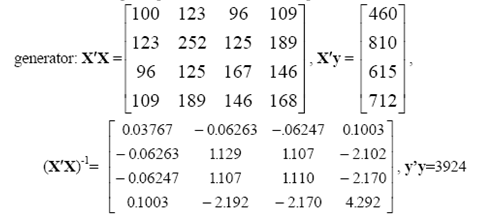
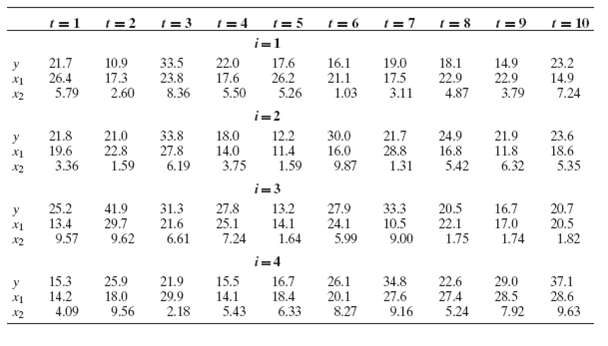
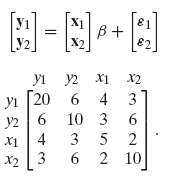
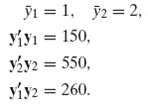
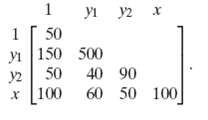
The following model is specified: y1 = γ1y2 + β11x1 + ε1, y2 = γ2y1 + β22x2 + β32x3 + ε2. All variables are measured as deviations from their means. The sample of 25 observations produces the
For the model y1 = γ1y2 + β11x1 + β21x2 + ε1, y2 = γ2y1 + β32x3 + β42x4 + ε2, show that there are two restrictions on the reduced-form coefficients. Describe a procedure for estimating the
Is the model stable? An updated version of Klein??s Model I was estimated. The relevant submatrix of ?? is
Prove that
Prove that an underidentified equation cannot be estimated by 2SLS.
Compare the fully parametric and semiparametric approaches to estimation of a discrete choice model such as the multinomial logit model discussed in Chapter 21. What are the benefits and costs of the
Asymptotics take on a different meaning in the Bayesian estimation context, since parameters do not “converge” to a population quantity. Nonetheless, in a Bayesian estimation setting, as the
Referring to the situation in Question 2, one might think that an informative prior would outweigh the effect of the increasing sample size.With respect to the Bayesian analysis of the linear
Using the gasoline market data in Appendix Table F2.2, use the partially linear regression method in Section 16.3.3 to fit an equation of the form ln(G/Pop) = β1 ln(Income) + β2 lnPnew cars + β3
To continue the analysis in Question 4, consider a nonparametric regression of G/Pop on the price. Using the nonparametric estimation method in Section 16.4.2 fit the nonparametric estimator using a
The extramarital affairs data analyzed in Section 22.3.7 can be reinterpreted in the context of a binary choice model. The dependent variable in the analysis is a count of events. Using these data,
Assume that the distribution of x is f (x) = 1/θ, 0 ≤ x ≤ θ. In random sampling from this distribution, prove that the sample maximum is a consistent estimator of θ. Note: You can prove that
In random sampling from the exponential distribution f (x) = (1/θ)e−x/θ, x ≥ 0, θ > 0, find the maximum likelihood estimator of θ and obtain the asymptotic distribution of this estimator.
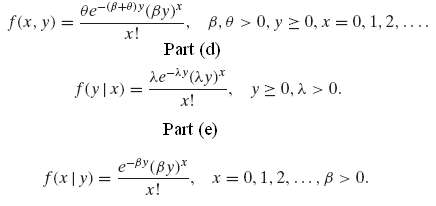
Mixture distribution suppose that the joint distribution of the two random variables x and y is a. Find the maximum likelihood estimators of β and θ and their asymptotic joint distribution. b. Find
Suppose that x has theWeibull distribution f (x) = αβxβ−1e−αxβ, x ≥ 0, α, β > 0. a. Obtain the log-likelihood function for a random sample of n observations.b. Obtain the likelihood
You might find it useful to read the early sections of Chapter 21 for this exercise.) The extramarital affairs data analyzed in Section 22.3.7 can be reinterpreted in the context of a binary choice
(Limited Information Maximum Likelihood Estimation) Consider a bivariate distribution for x and y that is a function of two parameters, α and β. The joint density is f (x, y | α, β). We consider
Show that the likelihood inequality in Theorem 17.3 holds for the Poisson distribution used in Section 17.3 by showing that E[(1/n) ln L(θ | y)] is uniquely maximized at θ = θ0. Hint:
Show that the likelihood inequality in Theorem 17.3 holds for the normal distribution.
For random sampling from the classical regression model in (17-3), reparameterize the likelihood function in terms of η = 1/σ and δ = (1/σ)β. Find the maximum likelihood estimators of η and δ
Section 14.3.1 presents estimates of a Cobb–Douglas cost function using Nerlove’s 1955 data on theU.S electric power industry. Christensen and Greene’s 1976 update of this study used 1970 data
Consider, sampling from a multivariate normal distribution with mean vector μ = (μ1, μ2, . . . , μM) and covariance matrix σ2I. The log-likelihood function is Show that the maximum likelihood
For the normal distribution μ2k = σ2k (2k)! / (k! 2k) and μ2k+1 = 0, k = 0, 1, . . . . Use this result to analyze the two estimators where mk = 1/n Σni=1 (xi ?? x)k. The following result will be
Using the results in Example 18.7, estimate the asymptotic covariance matrix of the method of moments estimators of P and λ based on m'1 and m'2 [Note: You will need to use the data in Example C.1
Exponential Families of Distributions for each of the following distributions, determine whether it is an exponential family by examining the log-likelihood function. Then, identify the sufficient
In the classical regression model with heteroscedasticity, which is more efficient, ordinary least squares or GMM? Obtain the two estimators and their respective asymptotic covariance matrices, then
Consider the probit model analyzed in Section 17.8. The model states that for given vector of independent variables, Prob[yi = 1 | xi ] = Ф [x'iβ], Prob [yi = 0 | xi ] = 1 − Prob[yi = 1 | xi]. We
Consider GMM estimation of a regression model as shown at the beginning of Example 18.8. Let W1 be the optimal weighting matrix based on the moment equations. Let W2 be some other positive definite
Suppose that the model of Exercise 4 were specified as
Describe how to estimate the parameters of the model where εt is a serially uncorrelated, homoscedastic, classical disturbance.
Obtain the mean lag and the long- and short-run multipliers for the following distributed lag models:a. yt = 0.55(0.02xt + 0.15xt−1 + 0.43xt−2 + 0.23xt−3 + 0.17xt−4) + et.b. The model in
Explain how to estimate the parameters of the following model: yt = α + βxt + γ yt−1 + δyt−2 + et, et = ρet−1 + ut. Is there any problem with ordinary least squares? Let yt be consumption
Show how to estimate a polynomial distributed lag model with lags of six periods and a third-order polynomial.
Expand the rational lag model yt = [(0.6 + 2L) / (1 − 0.6L+ 0.5L2)]xt + et . What are the coefficients on xt, xt−1, xt−2, xt−3, and xt−4?
We are interested in the long run multiplier in the model Assume that xt is an autoregressive series, xt = rxt??1 + vt where |r | a. What is the long run multiplier in this model? b. How would you
Find the autocorrelations and partial autocorrelations for the MA (2) process εt = vt − θ1vt−1 − θ2vt−2.
Carry out the ADF test for a unit root in the bond yield data of Example 20.1.
Using the macroeconomic data in Appendix Table F5.1, estimate by least squares the parameters of the model ct = β0 + β1yt + β2ct−1 + β3ct−2 + εt, where ct is the log of real consumption and
Verify the result in (20-10).
Show the Yule–Walker equations for an ARMA (1, 1) process.
Carry out an ADF test for a unit root in the rate of inflation using the subset of the data in Table F5.1 since 1974.1. (This is the first quarter after the oil shock of 1973)
Estimate the parameters of the model in Example 15.1 using two-stage least squares. Obtain the residuals from the two equations. Do these residuals appear to be white noise series? Based on your
A binomial probability model is to be based on the following index function model: y* = ? + ?d + ?, y = 1, if y* > 0, y = 0 otherwise. The only regress or, d, is a dummy variable. The data consist
Suppose that a linear probability model is to be fit to a set of observations on a dependent variable y that takes values zero and one, and a single regress or x that varies continuously across
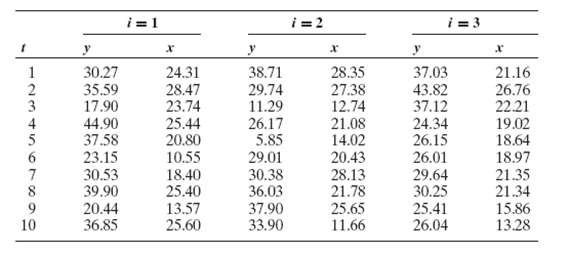
Given the data set estimate a probit model and test the hypothesis that x is not influential in determining the probability that y equalone.
Construct the Lagrange multiplier statistic for testing the hypothesis that all the slopes (but not the constant term) equal zero in the binomial log it model. Prove that the Lagrange multiplier
We are interested in the ordered probit model. Our data consist of 250 observations, of which the response are Using the preceding data, obtain maximum likelihood estimates of the unknown parameters
The following hypothetical data give the participation rates in a particular type of recycling program and the number of trucks purchased for collection by 10 towns in a small mid-Atlantic state:The
A data set consists of n = n1 + n2 + n3 observations on y and x. For the first n1 observations, y = 1 and x = 1. For the next n2 observations, y = 0 and x = 1. For the last n3 observations, y = 0 and
Data on t = strike duration and x = unanticipated industrial production for a number of strikes in each of 9 years are given in Appendix Table F22.1. Use the Poisson regression model discussed in
Asymptotic Explore whether averaging individual marginal effects gives the same answer as computing the marginal effect at the mean.
Prove (21-28).
In the panel data models estimated in Example 21.5.1, neither the log it nor the probit model provides a framework for applying a Hausman test to determine whether fixed or random effects is
The following 20 observations are drawn from a censored normal distribution: The applicable model is y*i = μ + εi, y + i = y*i if μ + εi > 0, 0 otherwise, εi ~ N [0, σ2]. Exercises 1 through
We now consider the Tobit model that applies to the full data set.a. Formulate the log-likelihood for this very simple Tobit model.b. Reformulate the log-likelihood in terms of θ = 1/σ and γ =
Using only the nonlimit observations, repeat Exercise 2 in the context of the truncated regression model, estimate μ and σ by using the method of moment’s estimator outlined in Example 22.2.
Continuing to use the data in Exercise 1, consider once again only the nonzero observations. Suppose that the sampling mechanism is as follows: y* and another normally distributed random variable z
Derive the marginal effects for the Tobit model with heteroscedasticity that is described in Section 22.3.4.a.
Prove that the Hessian for the Tobit model in (22-14) is negative definite after Olsen’s transformation is applied to the parameters.
Suppose a local government decides to increase the tax rate on residential properties under its jurisdiction. What will be the effect of this on the prices of residential houses? Follow the
How do you perceive the role of econometrics in decision making in business and economics?
Suppose you are an economic adviser to the Chairman of the Federal Reserve Board (the Fed), and he asks you whether it is advisable to increase the money supply to bolster the economy. What factors
To reduce the dependence on foreign oil supplies, the government is thinking of increasing the federal taxes on gasoline. Suppose the Ford Motor Company has hired you to assess the impact of the tax
Suppose the president of the United States is thinking of imposing tariffs on imported steel to protect the interests of the domestic steel industry. As an economic adviser to the president, what
Table 1-2 gives data on the Consumer Price Index (CPI), S&P 500 stock index, and three-month Treasury bill rate for the United States for the years 1980-2007.a. Plot these data with time on the
Table 1-3 gives you data on the exchange rate between the U.K. pound and the U.S. dollar (number of U.K. pounds per U.S. dollar) as well as the consumer price indexes in the two countries for the
Web site contains data on 1247 cars from 2008.14 Is there a strong relationship between a car's MPG (miles per gallon) and the number of cylinders it has? a. Create a scatter plot of the combined MPG
Explain carefully the meaning of each of the following terms: a. Population regression function (PRF). b. Sample regression function (SRF). c. Stochastic PRF. d. Linear regression model. e.
From the data given in the preceding problem, a random sample of Y was drawn against each X. The result was as follows:a. Draw the scatter gram with Y on the vertical axis and X on the horizontal
Suppose someone has presented the following regression results for your consideration: Ŷt = 2.6911 - 0.4795Xi where Y = coffee consumption in the United States (cups per person per day) X = retail
Table 2-9 gives data on the Consumer Price Index (CPI) for all items (1982-1984 = 100) and the Standard & Poor's (S&P) index of 500 common stock prices (base of index: 1941-1943 = 10).CONSUMER PRICE
Table 2-10 gives data on the nominal interest rate (Y) and the inflation rate (X) for the year 1988 for nine industrial countries.NOMINAL INTEREST RATE (Y) AND INFLATION (X) IN NINE INDUSTRIAL
The real exchange rate (RE) is defined as the nominal exchange rate (NE) times the ratio of the domestic price to foreign price. Thus, RE for the United States against UK is REUS = NEUS
In Table 2-11 we have data on CPI and the S&P 500 index for the years 1990 to 2007.CONSUMER PRICE INDEX (CPI) AND S&P 500INDEX (S&P), UNITED STATES, 1990-2007a. Repeat questions (a) to (e) from
Table 2-12, found on the textbook's Web site, gives data on average starting pay (ASP), grade point average (GPA) scores (on a scale of 1 to 4), GMAT scores, annual tuition, percent of graduates
Table 2-13 (found on the textbook's Web site) gives data on real GDP (V) and civilian unemployment rate (X) for the United States for period 1960 to 2006. a. Estimate Okun's law in the form of Eq.
a. Using a statistical package of your choice, confirm the regression results given in Eq. (2.24) and Eq. (2.25).b. For both regressions, get the estimated values of Y (i.e., Ŷi) and compare them
Table 2-14 gives the underlying data.a. Plot clock prices against the age of the clock and against the number of bidders. Does this plot suggest that the linear regression models shown in Eq. (2.27)
What is the difference between a stochastic population regression function (PRF) and a stochastic sample regression function (SRF)?
Look at the columns Y (actual Y) and Y (estimated Y) values. Plot the two in a scatter gram. What does the scatter gram reveal? If you believe that the fitted model [Eq. (2.20)] is a "good" model,
Scores for both males and females for the period 1972-2007. a. You want to predict the male math score (Y) on the basis of the male verbal score (X). Develop a suitable linear regression model and
Prove that ∑ei = 0, and hence show that = 0
Prove that ∑ei xi = 0.
Prove that ∑ei Ŷi = 0, that is, that the sum of the product of residuals ei and the estimated Yi is always zero.
Prove that = Ŷ, that is, that the means of the actual Y values and the estimated Y values are the same.
Prove that ∑xiyi = ∑xiyi = ∑xiyi, where xi - = (Xi - ) and yi - = (Yi - ).
Prove that ∑xi = ∑yi = 0, where xi and yi are as defined in Problem 2.27.
State whether the following statements are true, false, or uncertain. Give your reasons. Be precise. a. The stochastic error term ui and the residual term ei mean the same thing. b. The PRF gives the
What is the relationship between a. B1 and b1 b. B2 and b2 c. ui, and ei? Which of these entities can be observed and how?
Can you rewrite Eq. (2.22) to express X as a function of Y? How would you interpret the converted equation?
The following table gives pairs of dependent and independent variables. In each case state whether you would expect the relationship between the two variables to be positive, negative, or uncertain.
Showing 100 - 200
of 833
1
2
3
4
5
6
7
8
9