All Matches
Solution Library
Expert Answer
Textbooks
Search Textbook questions, tutors and Books
Oops, something went wrong!
Change your search query and then try again
Toggle navigation
FREE Trial
S
Books
FREE
Tutors
Study Help
Expert Questions
Accounting
General Management
Mathematics
Finance
Organizational Behaviour
Law
Physics
Operating System
Management Leadership
Sociology
Programming
Marketing
Database
Computer Network
Economics
Textbooks Solutions
Accounting
Managerial Accounting
Management Leadership
Cost Accounting
Statistics
Business Law
Corporate Finance
Finance
Economics
Auditing
Hire a Tutor
AI Study Help
New
Search
Search
Sign In
Register
study help
mathematics
econometric
Questions and Answers of
Econometric
The Two Variable Regression for the regression model y = α + β x + ε(a) Show that the least squares normal equations imply Σiei = 0 and Σi xi ei = 0. (b) Show that the solution for the constant
Change in the sum of squares. Suppose that b is the least squares coefficient vector in the regression of y on X and that c is any other K × 1 vector. Prove that the difference in the two sums of
Linear Transformations of the data, consider the least squares regression of y on K variables (with a constant) X. Consider an alternative set of regressors Z = XP, where P is a nonsingular matrix.
Partial Frisch and Waugh in the least squares regression of y on a constant and X, to compute the regression coefficients on X, we can first transform y to deviations from the mean y and, likewise,
A residual maker what is the result of the matrix productM1MwhereM1 is defined in (3-19) and M is defined in (3-14)?
Adding an observation, a data set consists of n observations on Xn and yn. The least squares estimator based on these n observations is bn = (X'n Xn)??1 X??n yn. Another observation, xs and ys,
Deleting an observation a common strategy for handling a case in which an observation is missing data for one or more variables is to fill those missing variables with 0s and add a variable to the
Demand system estimation. Let Y denote total expenditure on consumer durables, nondurables, and services and Ed, En, and Es are the expenditures on the three categories. As defined, Y = Ed + En + Es.
Change in adjusted R2. Prove that the adjusted R2 in (3-30) rises (falls) when variable xk is deleted from the regression if the square of the t ratio on xk in the multiple regression is less
Regression without a constant, suppose that you estimate a multiple regression first with then without a constant. Whether the R2 is higher in the second case than the first will depend in part on
Three variables, N, D, and Y, all have zero means and unit variances. A fourth variable is C = N + D. In the regression of C on Y, the slope is 0.8. In the regression of C on N, the slope is 0.5. In
Using the matrices of sums of squares and cross products immediately preceding Section 3.2.3, compute the coefficients in the multiple regression of real investment on a constant, real GNP and the
In the December, 1969, American Economic Review (pp. 886–896), Nathaniel Leaf reports the following least squares regression results for a cross section study of the effect of age composition on
Suppose that you have two independent unbiased estimators of the same parameter θ, say θ1 and θ2, with different variances v1 and v2. What linear combination θ = c1θ1 + c2θ2 is the minimum
Consider the simple regression yt = βxt + ε1 where E p[ε | x] = 0 and E [ε2 | x ] = σ2 (a) What is the minimum mean squared error linear estimator of β? Choose e to minimize Var [β] + [E(β ??
Suppose that the classical regression model applies but that the true value of the constant is zero. Compare the variance of the least squares slope estimator computed without a constant term with
Suppose that the regression model is yi = α + βxi + εi, where the disturbances εi have f (εi) = (1/λ) exp (−λεi), εi ≥ 0. This model is rather peculiar in that all the disturbances are
Prove that the least squares intercept estimator in the classical regression model is the minimum variance linear unbiased estimator.
As a profit maximizing monopolist, you face the demand curve Q = α + β P + ε. In the past, you have set the following prices and sold the accompanying
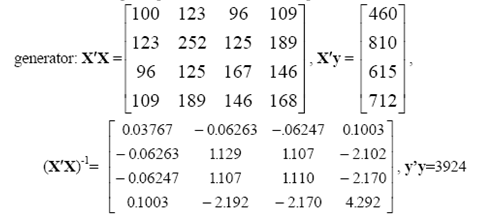
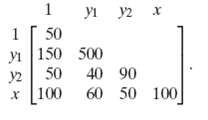
The following sample moments for x = [1, x1, x2, x3] were computed from 100 observations produced using a random number generator:? The true model underlying these data is y = x1 + x2 + x3 + ε. a.
Consider the multiple regression of y on K variablesXand an additional variable z. Prove that under the assumptions A1 through A6 of the classical regression model, the true variance of the least
For the classical normal regression model y = Xβ + ε with no constant term and K regressors, assuming that the true value of β is zero, what is the exact expected value of F[K, n − K] =
Prove that E[b' b] = β' β + σ2ΣKk=1(1/λk) where b is the ordinary least squares estimator and λk is a characteristic root of X' X.
Data on U.S. gasoline consumption for the years 1960 to 1995 are given in Table F2.2.a. Compute the multiple regression of per capita consumption of gasoline, G/pop, on all the other explanatory
For the classical normal regression model y = Xβ + ε with no constant term and K regressors, what is plim F[K, n – k] = plim R2/K/(1 – R2) / (n – k), assuming that the true value of β is
Let ei be the ith residual in the ordinary least squares regression of y on X in the classical regression model, and let εi be the corresponding true disturbance. Prove that plim (ei − εi) = 0.
For the simple regression model yi = μ + εi, εi ~ N [0, σ2], prove that the sample mean is consistent and asymptotically normally distributed. Now consider the alternative estimator μ = Σi wi
In the discussion of the instrumental variables estimator we showed that the least squares estimator b is biased and inconsistent. Nonetheless, b does estimate something: plim b = θ = β + Q−1γ.
For the model in (5-25) and (5-26), prove that when only x* is measured with error, the squared correlation between y and x is less than that between y* and x*. (Note the assumption that y* = y.)
Christensen and Greene (1976) estimated a generalized Cobb??Douglas cost function of the form ln(C/Pf) = α + β ln Q + γ (ln2 Q)/2 + δk ln(Pk/Pf) + δ1 ln(Pl/Pf) + ε. Pk, Pl and Pf indicate unit
The consumption function used in Example 5.3 is a very simple specification. One might wonder if the meager specification of the model could help explain the finding in the Hausman test. The data set
Suppose we change the assumptions of the model to AS5: (xi, ε) are an independent and identically distributed sequence of random vectors such that xi has a finite mean vector, μx, finite positive
Now, assume only finite second moments of x; E[x2i ] is finite. Is this sufficient to establish consistency of b? E [|xy|] ≤ {E[x2]} 1/2{E [y2]}1/2will be helpful.) Is this assumption sufficient to
A multiple regression of y on a constant x1 and x2 produces the following results: y = 4 + 0.4x1 + 0.9x2. R2 = 8/60, e' e = 520, n = 29,Test the hypothesis that the two slopes sum to 1.
Using the results in Exercise 1, test the hypothesis that the slope on x1 is 0 by running the restricted regression and comparing the two sums of squared deviations
The regression model to be analyzed is y = X1β1 + X2β2 + ε, where X1 and X2 have K1 and K2 columns, respectively. The restriction is β2 = 0. a. Using (6-14), prove that the restricted estimator
The expression for the restricted coefficient vector in (6-14) may be written in the form b* = [I − CR] b + w, where w does not involve b. What is C? Show that the covariance matrix of the
Prove the result that the restricted least squares estimator never has a larger covariance matrix than the unrestricted least squares estimator.
Prove the result that the R2 associated with a restricted least squares estimator is never larger than that associated with the unrestricted least squares estimator. Conclude that imposing
The Lagrange multiplier test of the hypothesis Rβ − q = 0 is equivalent to aWald test of the hypothesis that λ = 0, where λ is defined in (6-14). Prove that χ2 = λ'{Est.Var[λ]} −1 λ = (n
Use the Lagrange multiplier test to test the hypothesis in Exercise 1.
Using the data and model of Example 2.3, carry out a test of the hypothesis that the three aggregate price indices are not significant determinants of the demand for gasoline.
The full model of Example 2.3 may be written in logarithmic terms as lnG/pop = α + βp ln Pg + βy lnY + γnc ln Pnc + γuc ln Puc + γpt ln Ppt + β year + δd ln Pd + δn ln Pn + δs ln Ps + ε.
Prove that under the hypothesis that R β = q, the estimator where J is the number of restrictions, is unbiased for σ2.
Show that in the multiple regression of y on a constant, x1 and x2 while imposing the restriction β1 + β2 = 1 leads to the regression of y − x1 on a constant and x2 − x1.
In Solow’s classic (1957) study of technical change in the U.S. economy, he suggests the following aggregate production function: q(t) = A(t) f [k (t)], where q(t) is aggregate output per work
In the aforementioned study, Solow states: A scatter of q/A against k is shown in Chart 4. Considering the amount of a priori doctoring which the raw figures have undergone, the fit is remarkably
A regression model with K = 16 independent variables is fit using a panel of sevenyears of data. The sums of squares for the seven separate regressions and the pooled regression are shown below. The
Reverse regression. A common method of analyzing statistical data to detect discrimination in the workplace is to fit the regression y = α + x' β + γd + ε, (1) where y is the wage rate and d is a
Reverse regression continued. This and the next exercise continue the analysis of Exercise 4. In Exercise 4, interest centered on a particular dummy variable in which the regressors were accurately
Reverse regression continued. Suppose that the model in Exercise 5 is extended to y = βx?? + γd + ε, x = x?? + u. For convenience, we drop the constant term. Assume that x??, ε and u are
Suppose the true regression model is given by (8-2). The result in (8-4) shows that if either P1.2 is nonzero or β2 is nonzero, then regression of y on X1 alone produces a biased and inconsistent
Compare the mean squared errors of b1 and b1.2 in Section 8.2.2.
The J test in Example 8.2 is carried out using over 50 years of data. It is optimistic to hope that the underlying structure of the economy did not change in 50 years. Does the result of the test
The Cox test in Example 8.3 has the same difficulty as the J test in Example 8.2. The sample period might be too long for the test not to have been affected by underlying structural change. Repeat
Describe how to obtain nonlinear least squares estimates of the parameters of the model y = αxβ + ε.
Use MacKinnon, White, and Davidson’s PE test to determine whether a linear or loglinear production model is more appropriate for the data in Appendix Table F6.1. (The test is described in Section
Using the Box??Cox transformation, we may specify an alternative to the Cobb??Douglas model as Using Zellner and Revankar??s data in Appendix Table F9.2, estimate α, βk, βl, and λ by using the
For the model in Exercise 3, test the hypothesis that λ = 0 using a Wald test, a likelihood ratio test, and a Lagrange multiplier test. Note that the restricted model is the Cobb–Douglas
To extend Zellner and Revankar’s model in a fashion similar to theirs, we can use the Box–Cox transformation for the dependent variable as well. Use the method of Example 17.6 (with θ = λ) to
Verify the following differential equation, which applies to the Box??Cox transformation: Show that the limiting sequence for λ = 0 is these results can be used to great advantage in deriving the
What is the covariance matrix, Cov [β, β − b], of the GLS estimator β = (X'Ω−1X)−1 X'Ω−1 y and the difference between it and the OLS estimator, b =(X' X)−1 X'y? The result plays a
This and the next two exercises are based on the test statistic usually used to test a set of J linear restrictions in the generalized regression model: where β is the GLS estimator. Show that if ??
Now suppose that the disturbances are not normally distributed, although Ω is still known. Show that the limiting distribution of previous statistic is (1/J) times a chisquared variable with J
Finally, suppose that Ω must be estimated, but that assumptions (10-27) and (10-31) are met by the estimator. What changes are required in the development of the previous problem?
a. Prove the result directly using matrix algebra.b. Prove that if X contains a constant term and if the remaining columns are in deviation form (so that the column sum is zero), then the model of
In the generalized regression model, suppose that Ω is known.a. What is the covariance matrix of the OLS and GLS estimators of β?b. What is the covariance matrix of the OLS residual vector e = y
Suppose that y has the pdf f (y | x) = (1/x'β)e−y/(β'x), y > 0. Then E[y | x] = β'x and Var[y | x] = (β'x)2. For this model, prove that GLS and MLE are the same, even though this
Suppose that the regression model is y = μ + ε, where ε has a zero mean, constant variance, and equal correlation ρ across observations. Then Cov [εi, εj] = σ2ρ if i ≠ j . Prove that the
Suppose that the regression model is yi = μ + εi, where E[εi | xi ] = 0, Cov[εi, εj | xi , xj] = 0 for i ≠ j , but Var[εi | xi] = σ2x2i , xi > 0.a. Given a sample of observations on yi
For the model in the previous exercise, what is the probability limit of s2 = 1/n Σni=1 (yi − y)2? Note that s2 is the least squares estimator of the residual variance. It is also n times
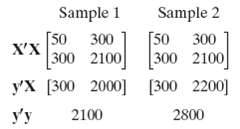
Two samples of 50 observations each produce the following moment matrices. (In each case, X is a constant and one variable.) a. Compute the least squares regression coefficients and the residual
Using the data in Exercise 3, use the Oberhofer–Kmenta method to compute the maximum likelihood estimate of the common coefficient vector
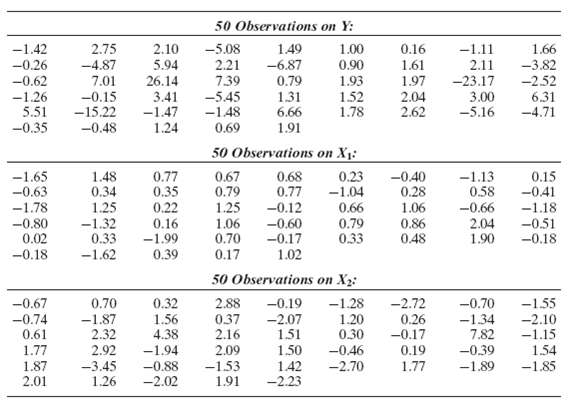
This exercise is based on the following data set. a. Compute the ordinary least squares regression of Y on a constant, X1, and X2. Be sure to compute the conventional estimator of the asymptotic
Using the data of Exercise 5, reestimate the parameters using a two-step FGLS estimator. Try the estimator used in Example 11.4.
For the model in Exercise 1, suppose that ε is normally distributed, with mean zero and variance σ2 [1 + (γ x)2]. Show that σ2 and γ2 can be consistently estimated by a regression of the least
Derive the log-likelihood function, first-order conditions for maximization, and information matrix for the model yi = x'iβ + εi, εi ~ N [0, σ2(γ' zi )2].
In the discussion of Harvey’s model in Section 11.7, it is noted that the initial estimator of γ1, the constant term in the regression of ln e2i on a constant, and zi is inconsistent by the amount
(This exercise requires appropriate computer software. The computations required can be done with RATS, EViews, Stata, TSP, LIMDEP, and a variety of other software using only preprogrammed
Does first differencing reduce autocorrelation? Consider the models yt = β'xt +εt, where εt = ρεt−1 + ut and εt = ut − λut−1. Compare the autocorrelation of εt in the original model
Derive the disturbance covariance matrix for the model ?What parameter is estimated by the regression of the OLS residuals on their lagged values?
The following regression is obtained by ordinary least squares, using 21 observations. (Estimated asymptotic standard errors are shown in parentheses.) yt = 1.3 + 0.97yt−1 + 2.31xt , D − W =
It is commonly asserted that the Durbin–Watson statistic is only appropriate for testing for first-order autoregressive disturbances. What combination of the coefficients of the model is estimated
The data used to fit the expectations augmented Phillips curve in Example 12.3 are given in Table F5.1. Using these data, reestimate the model given in the example. Carry out a formal test for first
Data for fitting an improved Phillips curve model can be obtained from many sources, including the Bureau of Economic Analysis’s (BEA) own website, Economagic. Com and so on, obtain the necessary
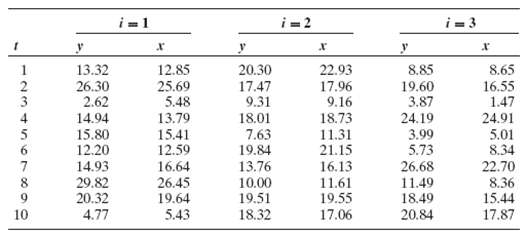
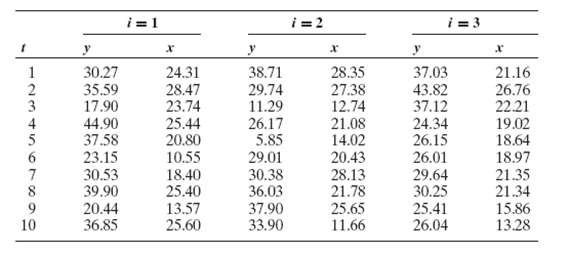
The following is a panel of data on investment (y) and profit (x) for n = 3 firms over T = 10 periods. a. Pool the data and compute the least squares regression coefficients of the model yi t = α +
Suppose that the model of (13-2) is formulated with an overall constant term and n − 1 dummy variables (dropping, say, the last one). Investigate the effect that this supposition has on the set of
Use the data in Section 13.9.7 (the Grunfeld data) to fit the random and fixed effect models. There are five firms and 20 years of data for each. Use the F, LM, and/or Hausman statistics to determine
Derive the log-likelihood function for the model in (13-18), assuming that εit and ui are normally distributed.
Unbalanced design for random effects, suppose that the random effects model of Section 13.4 is to be estimated with a panel in which the groups have different numbers of observations. Let Ti be the
What are the probability limits of (1/n) LM, where LM is defined in (13-31) under the null hypothesis that σ2 u = 0 and under the alternative that σ2u ≠ 0?
A two-way fixed effects model, suppose that the fixed effects model is modified to include a time-specific dummy variable as well as an individual-specific variable. Then yit = αi + γt + β'xit +
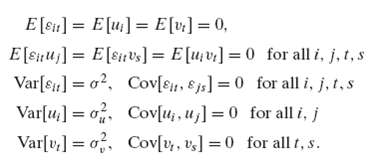
Two-way random effects model, we modify the random effects model by the addition of a time specific disturbance. Thus, yit = α + β'xit + εit + ui + vt, where Write out the full covariance
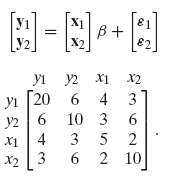
The model satisfies the Group Wise heteroscedastic regression model of Section 11.7.2. All variables have zero means. The following sample second-moment matrix is obtained from a sample of 20
Suppose that in the group wise heteroscedasticity model of Section 11.7.2, Xi is the same for all i. What is the generalized least squares estimator of β? How would you compute the estimator if it
Repeat Exercise 10 for the cross sectionally correlated model of Section 13.9.1.
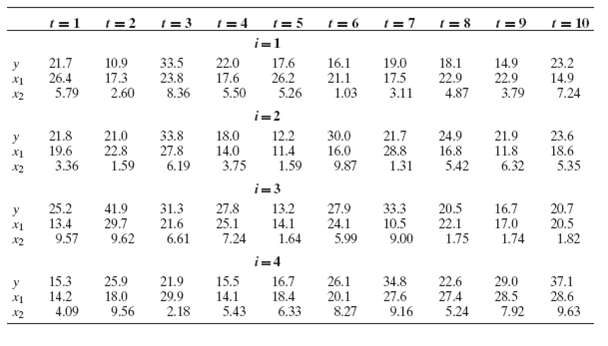
The following table presents a hypothetical panel of data: a. Estimate the group wise heteroscedastic model of Section 11.7.2. Include an estimate of the asymptotic variance of the slope estimator.
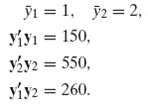
A sample of 100 observations produces the following sample data: The underlying bivariate regression model is y1 = μ + ε1, y2 = μ + ε2. a. Compute the OLS estimate of μ, and estimate the
Consider estimation of the following two equation model: y1 = β1 + ε1, y2 = β2x + ε2. A sample of 50 observations produces the following moment matrix: a. Write the explicit formula for the GLS
The model y1 = β1x1 + ε1, y2 = β2x2 + ε2 satisfies all the assumptions of the classical multivariate regression model. All variables have zero means. The following sample second-moment matrix is
Showing 1 - 100
of 833
1
2
3
4
5
6
7
8
9