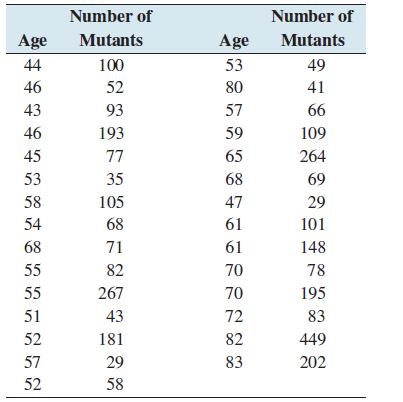
In a study to determine whether the frequency of a certain mutant gene increases with age, the
Question:
In a study to determine whether the frequency of a certain mutant gene increases with age, the number of mutant genes per microgram of DNA was counted for each of 29 men. The results are presented in the following table.
a. Compute the least-squares regression line for predicting number of mutants from age.
b. Construct a scatterplot of number of mutants (y) versus age (x).
c. Which point is an outlier?
d. Remove the outlier and compute the least-squares regression line for predicting number of mutants from age.
e. Is the outlier influential? Explain.
Fantastic news! We've Found the answer you've been seeking!
Step by Step Answer:
Related Book For 

Question Posted:


