Question: Activity 2 Accelerated Motion Introduction How can we use mathematics to express the way an object moves when it is speeding up? The velocity of
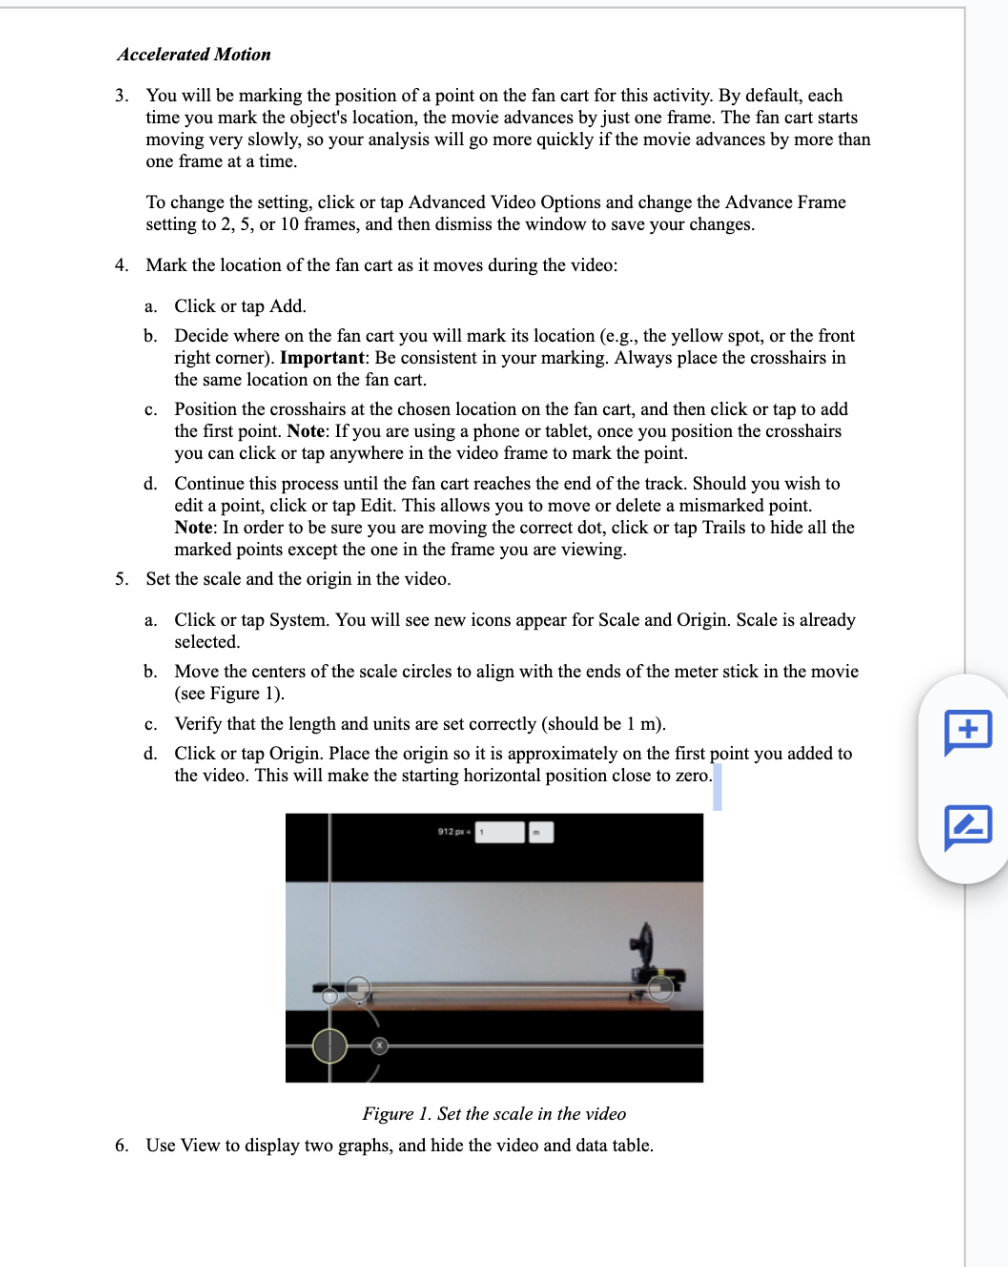
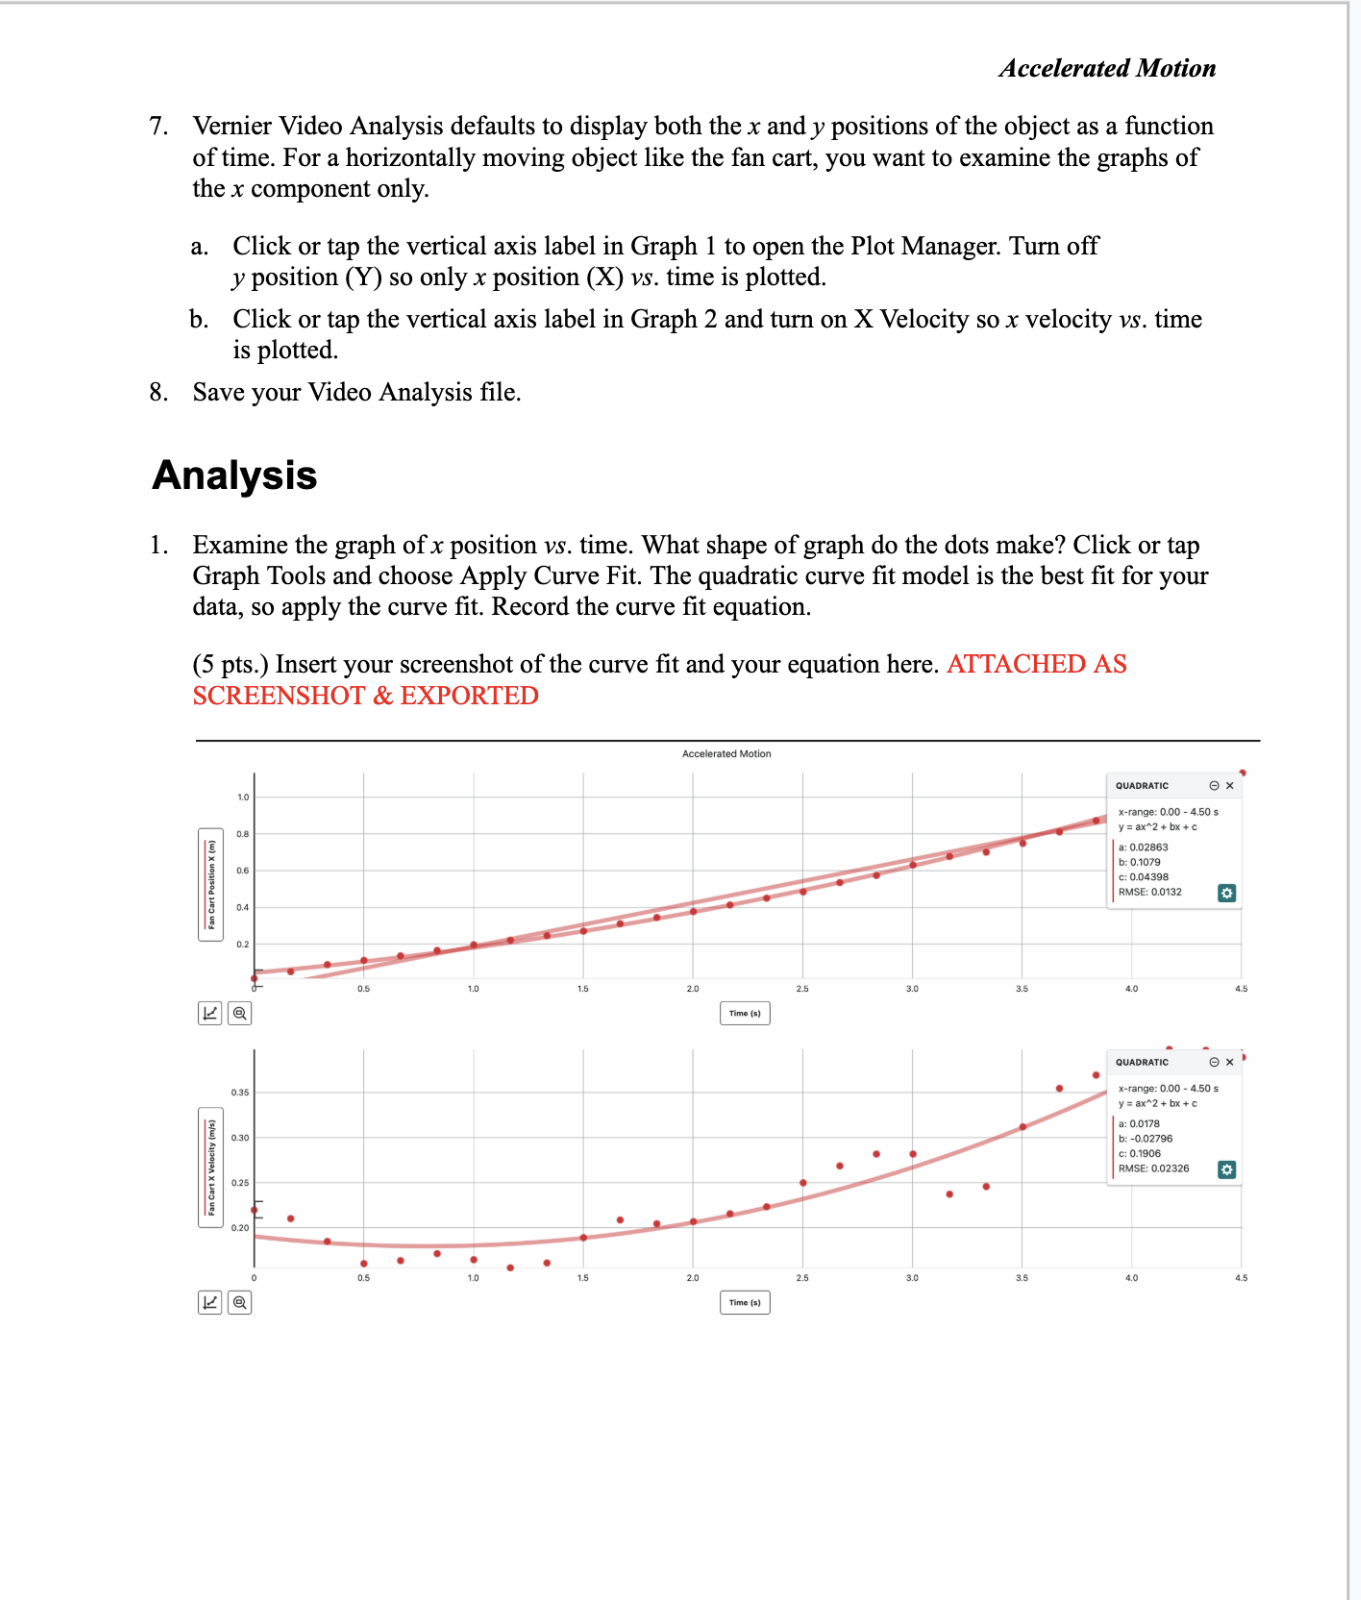
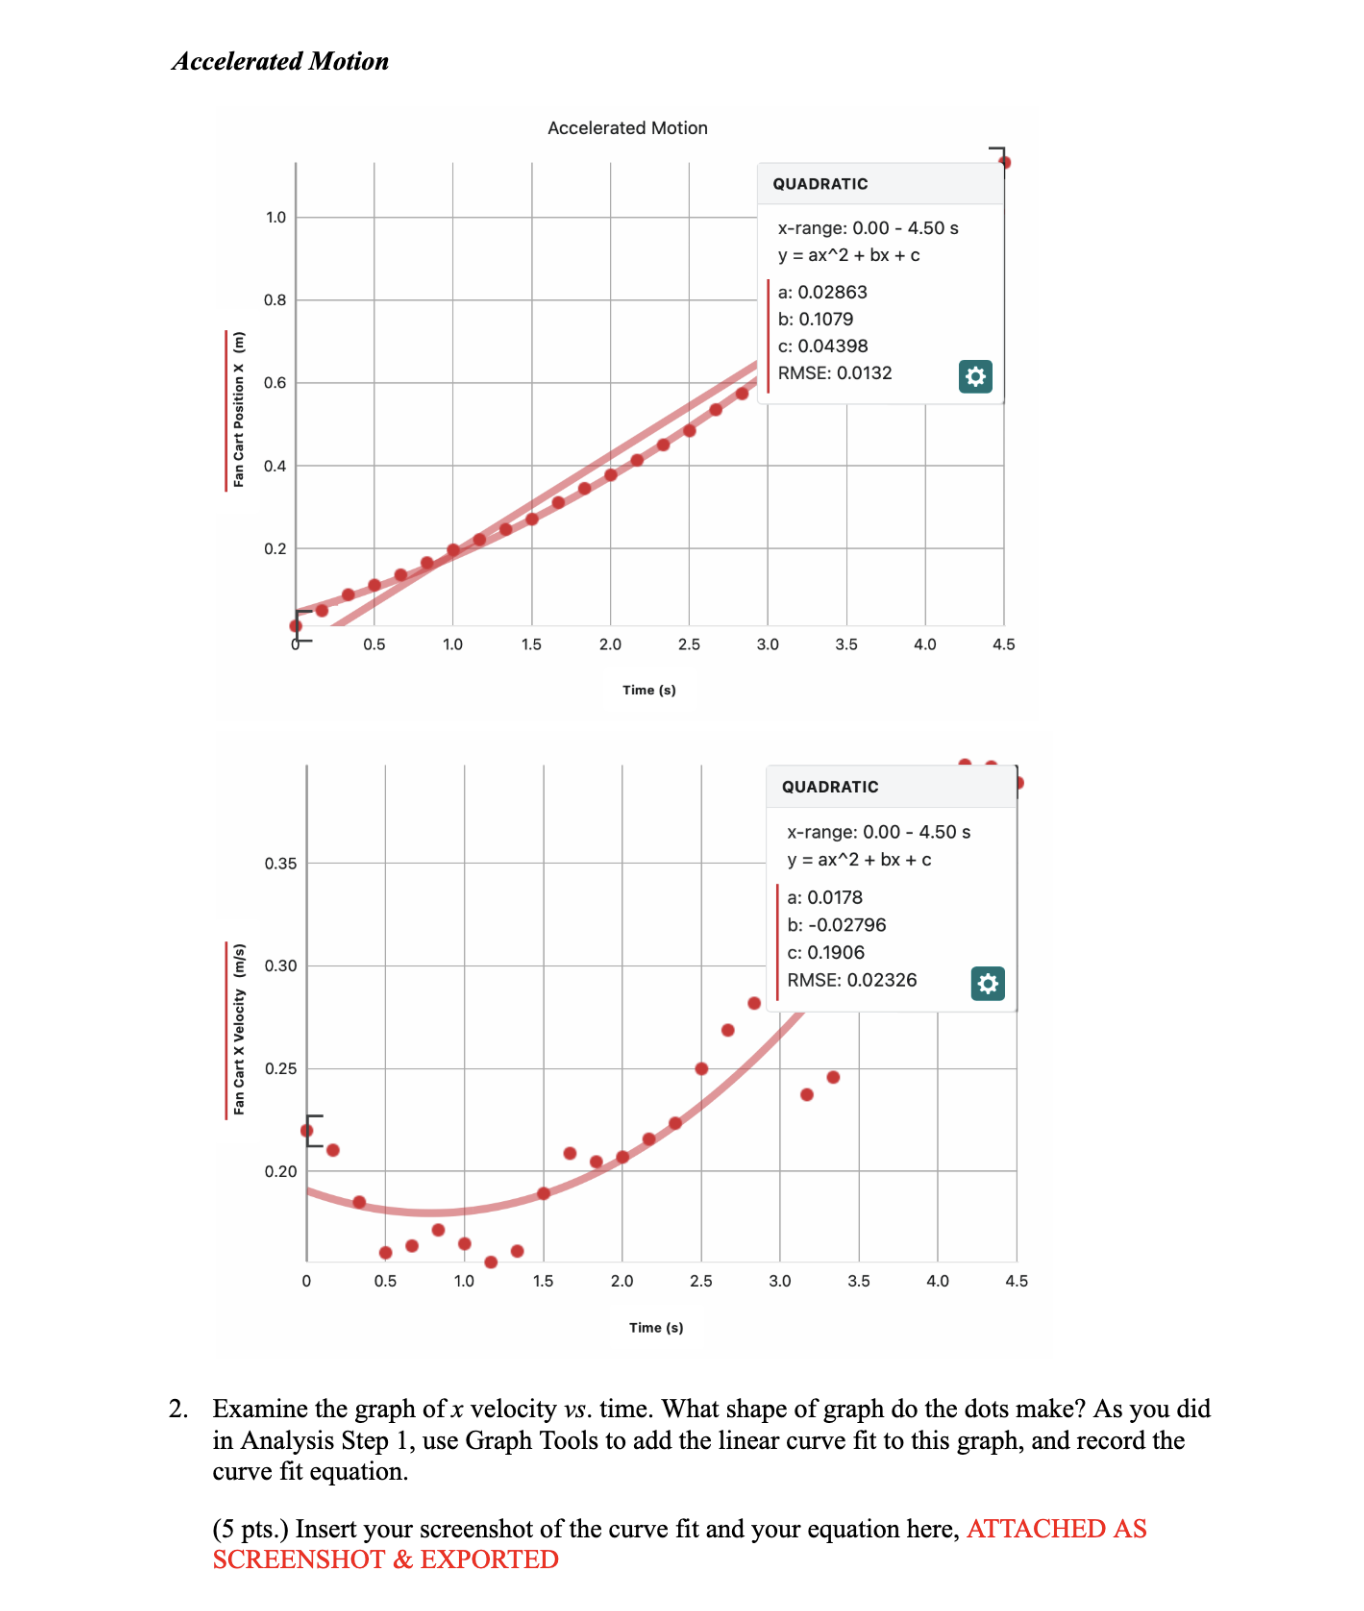
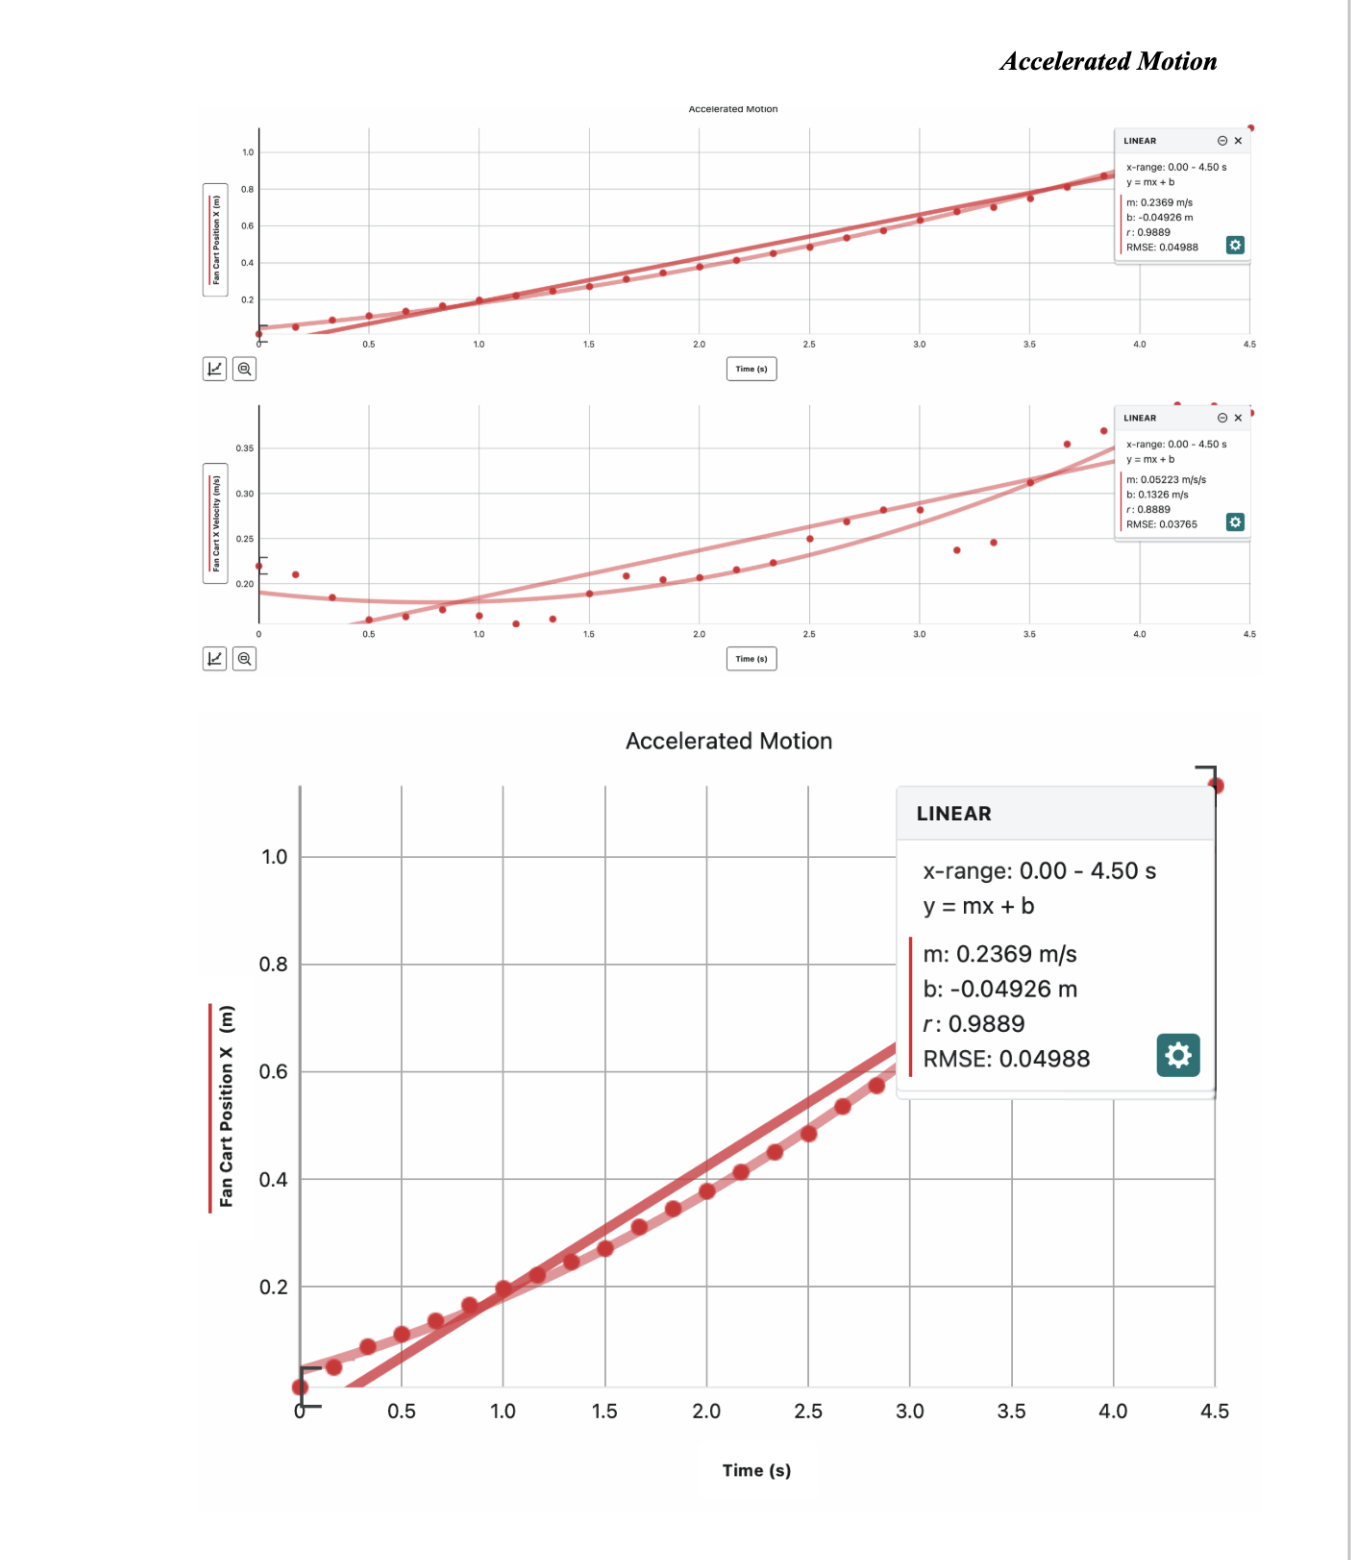
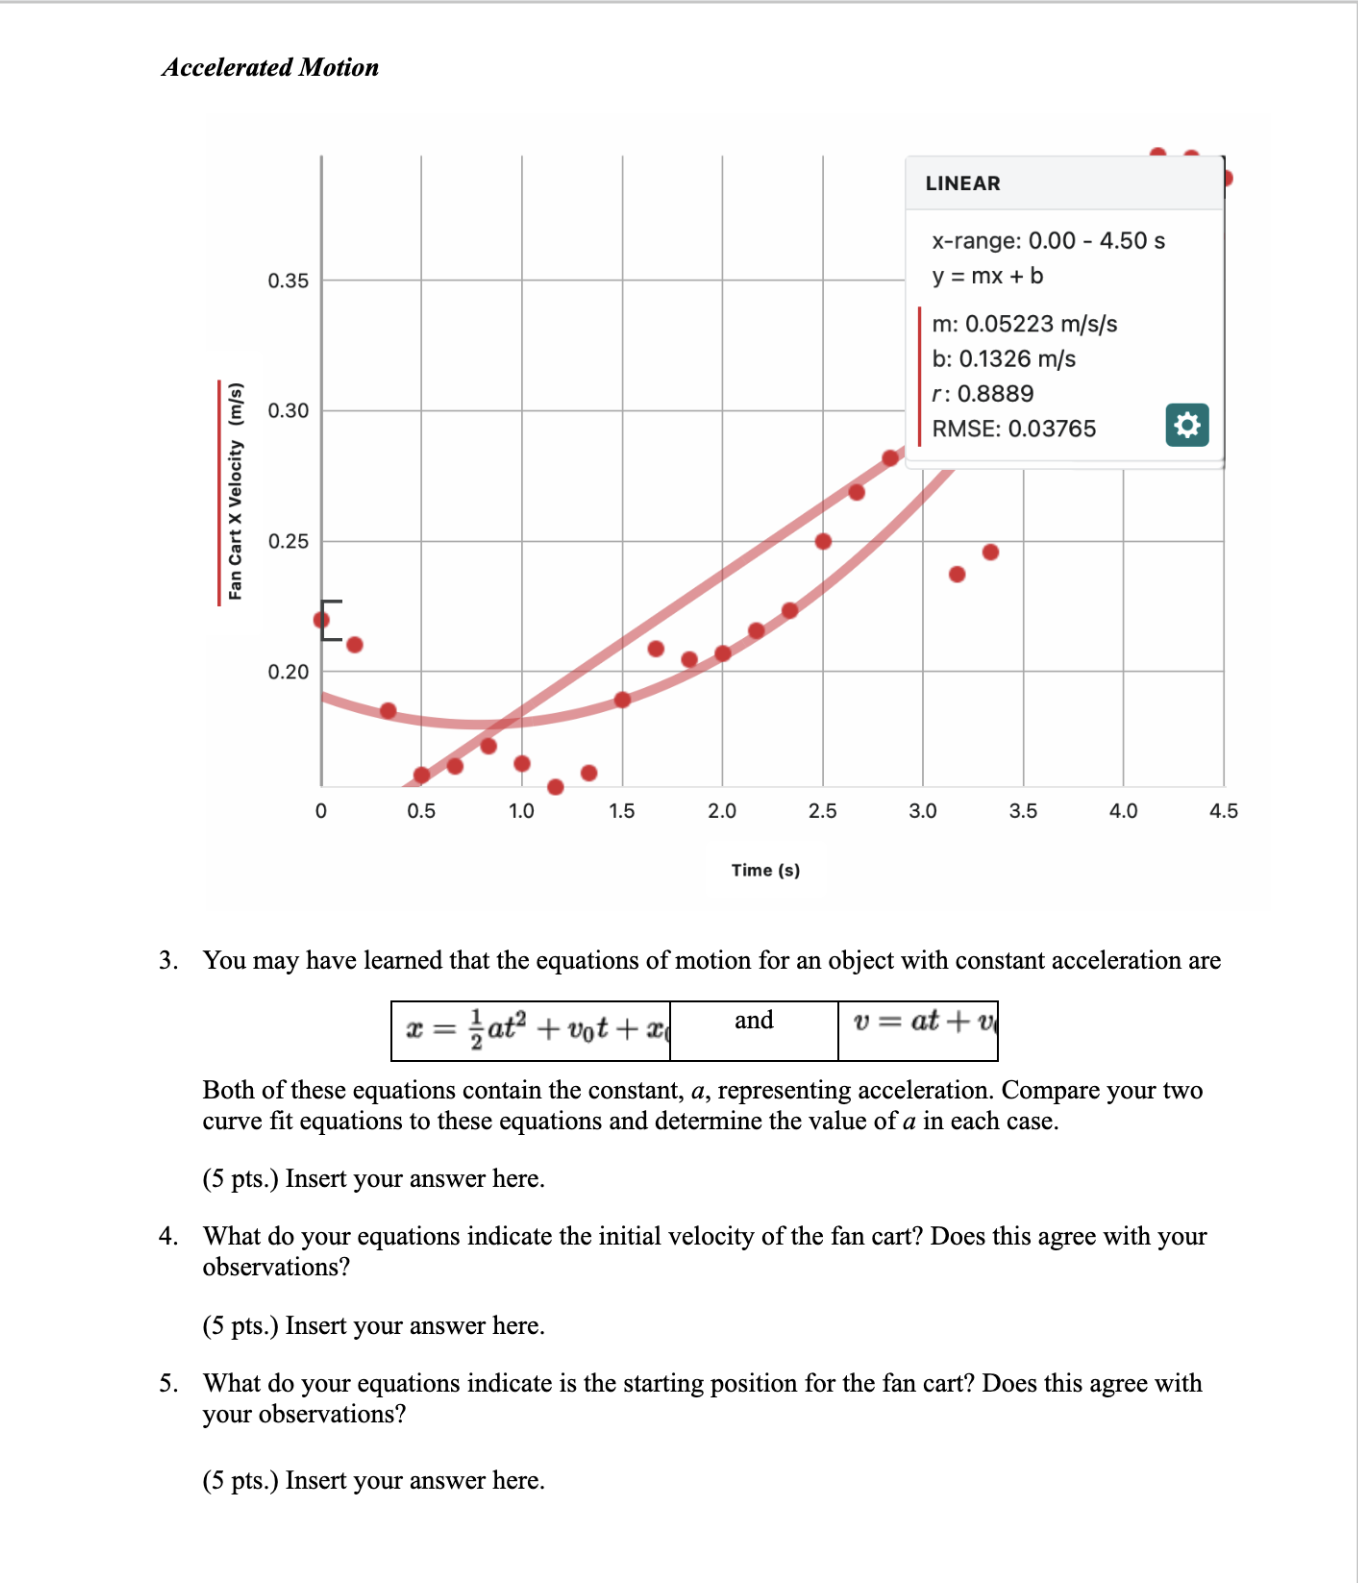
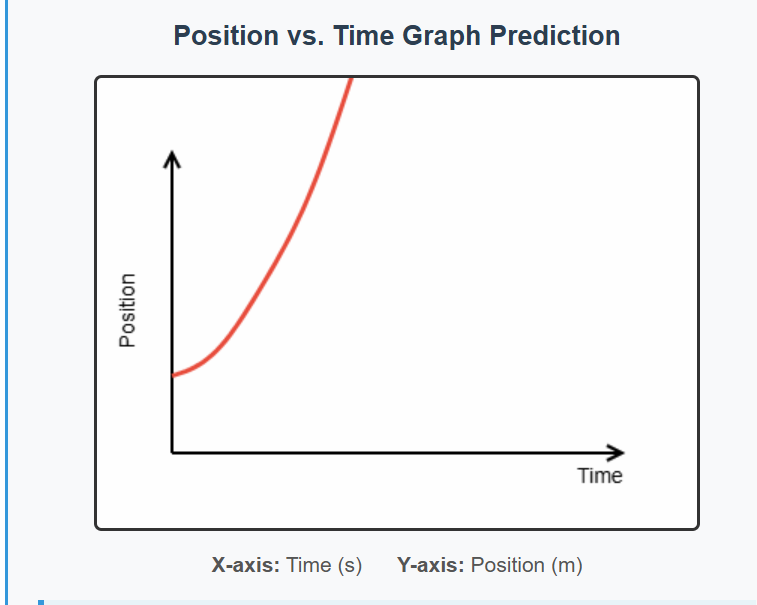
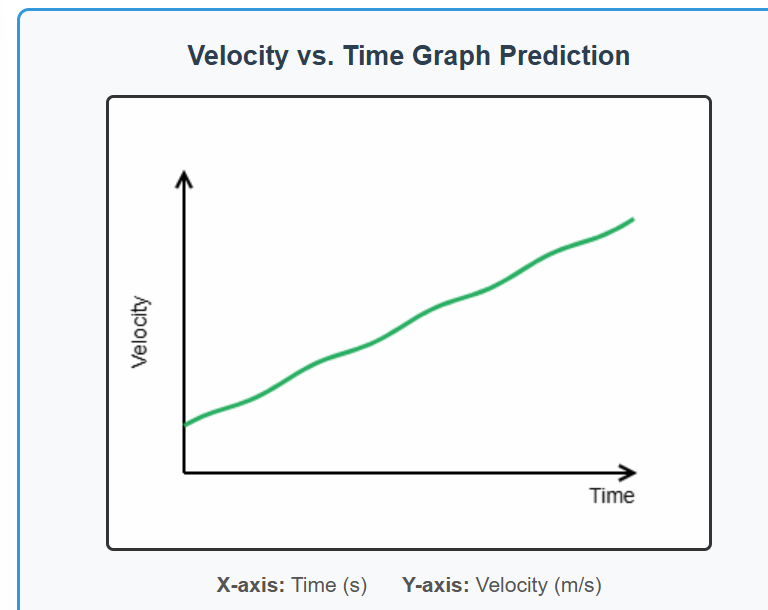
Activity 2 Accelerated Motion Introduction How can we use mathematics to express the way an object moves when it is speeding up? The velocity of the object is constantly changing, rather than a steady value. In this exercise, you will apply curve fits to graphs of position vs. time and velocity vs. time for a fan cart. You will use the curve fits to determine the parameters of the motion. Objectives In this experiment, you will Use video analysis techniques to obtain position, velocity, and time data for a cart that is speeding up. Apply curve fits to your graphs to determine how to mathematically describe the motion. Materials Vernier Video Analysis app in a web browser on a computer, Chromebook, or mobile device Pre-Lab Investigation 1. Launch Vernier Video Analysis. Import the movie "Fan Cart." Play the movie once or twice to observe the motion of the cart. 2. Make a prediction of how the position vs. time graph and the velocity vs. time graph will look for the motion of the cart, and sketch your predictions. (5 pts.) Insert your answer here. Procedure 1. Make the movie window large enough to easily view the motion of the fan cart. There are two ways to do this: 1) Click or tap the divider between the video and the other elements on the screen, and drag the divider to the right, or 2) use View to remove the graph and data table from view. 2. Click or tap Reset Video and then use the Step Forward and Step Back buttons to advance the movie to the frame in which the fan cart is clearly no longer held in place. Accelerated Motion 3. You will be marking the position of a point on the fan cart for this activity. By default, each time you mark the object's location, the movie advances by just one frame. The fan cart starts moving very slowly, so your analysis will go more quickly if the movie advances by more than one frame at a time. To change the setting, click or tap Advanced Video Options and change the Advance Frame setting to 2, 5, or 10 frames, and then dismiss the window to save your changes. 4. Mark the location of the fan cart as it moves during the video: 5. a. b. Click or tap Add. Decide where on the fan cart you will mark its location (e.g., the yellow spot, or the front right corner). Important: Be consistent in your marking. Always place the crosshairs in the same location on the fan cart. Position the crosshairs at the chosen location on the fan cart, and then click or tap to add the first point. Note: If you are using a phone or tablet, once you position the crosshairs you can click or tap anywhere in the video frame to mark the point. Continue this process until the fan cart reaches the end of the track. Should you wish to edit a point, click or tap Edit. This allows you to move or delete a mismarked point. Note: In order to be sure you are moving the correct dot, click or tap Trails to hide all the marked points except the one in the frame you are viewing. Set the scale and the origin in the video. a. Click or tap System. You will see new icons appear for Scale and Origin. Scale is already selected. Move the centers of the scale circles to align with the ends of the meter stick in the movie (see Figure 1). Verify that the length and units are set correctly (should be | m). Click or tap Origin. Place the origin so it is approximately on the first point you added to the video. This will make the starting horizontal position close to zero. Figure 1. Set the scale in the video 6. Use View to display two graphs, and hide the video and data table. Accelerated Motion Vernier Video Analysis defaults to display both the x and y positions of the object as a function of time. For a horizontally moving object like the fan cart, you want to examine the graphs of the x component only. a. Click or tap the vertical axis label in Graph | to open the Plot Manager. Turn off y position (Y) so only x position (X) vs. time is plotted. b. Click or tap the vertical axis label in Graph 2 and turn on X Velocity so x velocity vs. time is plotted. Save your Video Analysis file. Analysis I, Examine the graph of x position vs. time. What shape of graph do the dots make? Click or tap Graph Tools and choose Apply Curve Fit. The quadratic curve fit model is the best fit for your data, so apply the curve fit. Record the curve fit equation. (5 pts.) Insert your screenshot of the curve fit and your equation here. ATTACHED AS SCREENSHOT & EXPORTED Accelerated Motion QUADRATIC @x 10 5 *range: 0.00-4.50s - y=ax"2 + bx + oa E #: 0.02863 5 | 00 * b: 0.1078 = f c: 0.04398 : . z RMSE: 0.0132 o t o4 i * - - . . " a2 * . 0.5 5 2. 25 30 35 ao 5 [1] /@| mest | QUADRATIC ex!' . Per . 4 Xerange: 0.00 - 4.505 a y=ax"2+bx+e z . a: 0.0178 | oa0 - b: -0.02796 3 * . 2 ' RMSE: 0.02326 o Fa ; 0.26 _ . $ . . . * . . i - L___} 920 A i. * . . . 4} |@] [ time | Accelerated Motion 1.0 0.8 Fan Cart Position X (m) 0.5 1.0 1.5 Fan Cart X Velocity (m/s) 0 0.5 1.0 1.5 Accelerated Motion QUADRATIC x-range: 0.00 - 4.50 s y =ax*2 + bx +c a: 0.02863 b: 0.1079 c: 0.04398 RMSE: 0.0132 3 3.0 3.5 4.0 4.5 QUADRATIC x-range: 0.00 - 4.50 s y =ax*2 + bx+c a: 0.0178 b: -0,02796 c: 0.1906 RMSE: 0.02326 3.0 3.5 4.0 45 2. Examine the graph of x velocity vs. time. What shape of graph do the dots make? As you did in Analysis Step 1, use Graph Tools to add the linear curve fit to this graph, and record the curve fit equation. (5 pts.) Insert your screenshot of the curve fit and your equation here, ATTACHED AS SCREENSHOT & EXPORTED \fAccelerated Motion LINEAR x-range: 0.00 - 4.50 s 0.35 | | y=mx+b m: 0.05223 m/s/s b: 0.1326 m/s 0.30 | r: 0.8889 | RMSE: 0.03765 E} Fan Cart X Velocity (m/s) 0 0.5 1.0 1.5 2.0 2.5 3.0 3.5 4.0 4.5 Time (s) 3. You may have learned that the equations of motion for an object with constant acceleration are ca pattmttay om jee ts Both of these equations contain the constant, a, representing acceleration. Compare your two curve fit equations to these equations and determine the value of a in each case. (5 pts.) Insert your answer here. 4. What do your equations indicate the initial velocity of the fan cart? Does this agree with your observations? (5 pts.) Insert your answer here. 5. What do your equations indicate is the starting position for the fan cart? Does this agree with your observations? (5 pts.) Insert your answer here. Position vs. Time Graph Prediction Position Time X-axis: Time (s) Y-axis: Position (m)Velocity vs. Time Graph Prediction Velocity Time X-axis: Time (s) Y-axis: Velocity (m/s)
Step by Step Solution
There are 3 Steps involved in it
1 Expert Approved Answer
Step: 1 Unlock
Question Has Been Solved by an Expert!
Get step-by-step solutions from verified subject matter experts
Step: 2 Unlock
Step: 3 Unlock
Students Have Also Explored These Related Accounting Questions!