

Question: b ) Display the following in the command window (154Csider the following table that contains the ID: 10 tips and their re thes line d
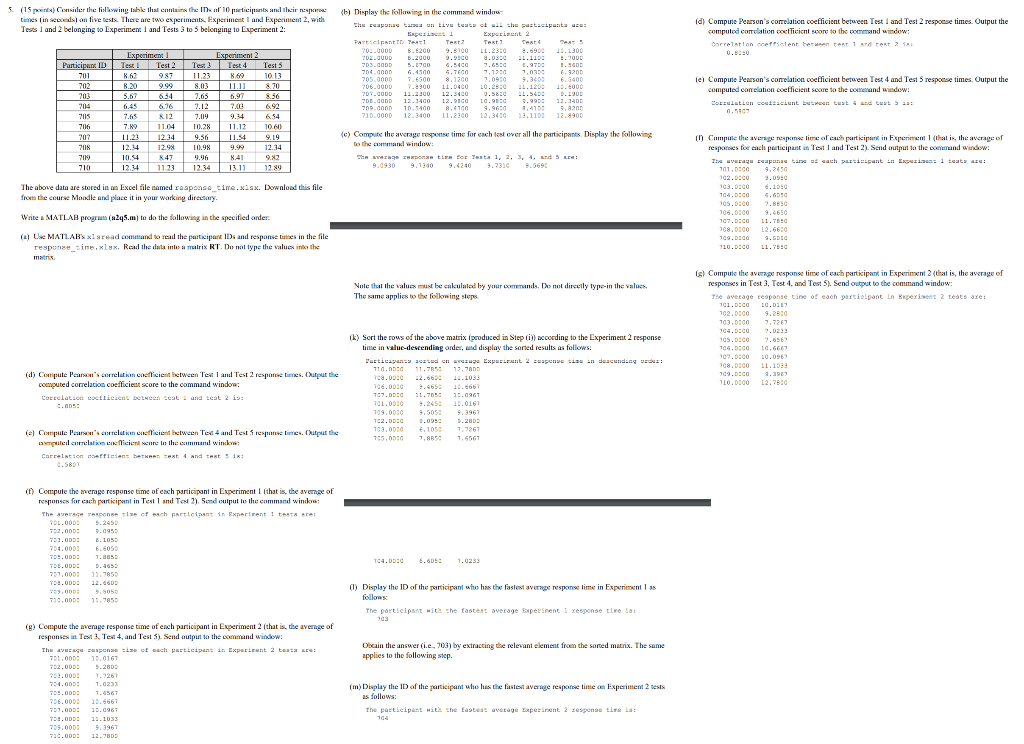
b ) Display the following in the command window (154Csider the following table that contains the ID: 10 tips and their re thes line d an five tests. There are two experiments, Experiment and Experiment 2, with Tests 1 and 2 belonging to experimen and Tesis 3 to 5 belonging to experiment 2: the sauna tasca un livu tuttu.. che puztacirunta usu Id) Compute Pearson's correlation coefficient between Test I and Test 2 response times. Output the computed correlation coefficient sconto the command window: Correlation coeficient between tast 1 and test ? PATEICpant ID Text Text Text Experiment Test Test 2 Experiment 2 Test 4 Participen ID Tes 3 Test 5 702 1.300 1.04000.250 120 15000 3.20 5.03 9.998,03 6.34 2.65 11 0.97 70 8.36 le) Compute Pearson's correlation coefficient between Test 4 and Test 5 response times. Output the computed correlation coefficient score to the command widow: Correlation cost aciunt between tut ud tust si: 0.550 705 (c) Compute the average response time for each sest over all the participants. Display the following 7.65 7.89 11.23 12.34 11.54 12.34 .127.099.34 11.04 10.28 11.12 12.34 9 .56 11.54 12.98 10.98 9 .99 47 1996 8.41 11.73 12.341 13.11 10.61) 9.19 12.34 9.X2 12.89 in Compute the average op timaal each participant in Experiment that is, the average of respores for each participanti Test I and Test 2). Send output to the command Window: Change Inxpn tin for Test 1, 2, 3, 4, US : 9.0930 9.73409 .4240 9.7310 9.5690 The wvergu seaponse times cach partiespunt in Expezit 701,0:00 9,2450 i tuata su: 710 The above data are stored in an Excel file named response time.xlsx. Download this file from the course Moodle and place it in your working directory 100. 00 9.4650 Write MATLAB program (298.m) to do the following in the specified order. 108. DECOP2.660 (4) Uwe MATLAB's isread command to read the participants and response tites in the file response tine.xlsx. Rand the data into mutrix RT. Do not type the values into the 110.000 11.750 Note that the values munbe calculated by your brands. Do not directly type in the values. The same applies to the following steps (s) Compute the average response time of each participant in Experiment 2 (that is, the average of responses in Test 3. Testand Test 5). Send output to the command window The average response time of each participant in pexit 2 tests are: 702. DECO (k) Sort the rows of the above matrix produced in Stepi)) according to the Experiment 2 response time in value-descending order, and display the sorted results as follows: v e Experiment 2 ugene tine in descending bes: 706.000 107.0. 108. DECO 10.6667 10.0963 103 110.DECO 12.7830 id) Centipute Pearson's cercato dicient between Text 1 and Test 2 responses. Dutput the computed correlation coefficient score to the command window: Correlation colliesent to eat and Ecot 2 is: 799.00C 3.505 3 967 703.000 , 105 1,7261 es. Dutput the le) Corpule Pear 's c smule corelat laim caefficient between Text 4 and Test 5 respons calicien seure to the e mand window 0.5801 (t) Compute the average response time of each participant in Experimenti (that is, the average of responses for each participant in Test and Test 2). Send output to the command winck response ise of each particians in Experiment 1 testa 104.09: 6 .6050 1.0233 il) Display the ID of the articipant who has the thesis a nd response time in Experiments follows: The participant with the fastest average Experiment i response time to (c) Compute the average response time of each participant in Experiment 2 (that is, the average of responses in Test Test 4, and Test 5). Send output to the command window: response time of each participant in Experiment 2 teatase: Obcain the answer i.e. 703) by extracting the relevant element from the sorted matrix. The same applies to the following step. 9.2803 Experiment 2 tests im) Display the ID of the participant who has the fastest avere response time as follows: 06.000 10.6667 The participant with the fastest average Experiment 2 response time : 730.003: 32.3803 b ) Display the following in the command window (154Csider the following table that contains the ID: 10 tips and their re thes line d an five tests. There are two experiments, Experiment and Experiment 2, with Tests 1 and 2 belonging to experimen and Tesis 3 to 5 belonging to experiment 2: the sauna tasca un livu tuttu.. che puztacirunta usu Id) Compute Pearson's correlation coefficient between Test I and Test 2 response times. Output the computed correlation coefficient sconto the command window: Correlation coeficient between tast 1 and test ? PATEICpant ID Text Text Text Experiment Test Test 2 Experiment 2 Test 4 Participen ID Tes 3 Test 5 702 1.300 1.04000.250 120 15000 3.20 5.03 9.998,03 6.34 2.65 11 0.97 70 8.36 le) Compute Pearson's correlation coefficient between Test 4 and Test 5 response times. Output the computed correlation coefficient score to the command widow: Correlation cost aciunt between tut ud tust si: 0.550 705 (c) Compute the average response time for each sest over all the participants. Display the following 7.65 7.89 11.23 12.34 11.54 12.34 .127.099.34 11.04 10.28 11.12 12.34 9 .56 11.54 12.98 10.98 9 .99 47 1996 8.41 11.73 12.341 13.11 10.61) 9.19 12.34 9.X2 12.89 in Compute the average op timaal each participant in Experiment that is, the average of respores for each participanti Test I and Test 2). Send output to the command Window: Change Inxpn tin for Test 1, 2, 3, 4, US : 9.0930 9.73409 .4240 9.7310 9.5690 The wvergu seaponse times cach partiespunt in Expezit 701,0:00 9,2450 i tuata su: 710 The above data are stored in an Excel file named response time.xlsx. Download this file from the course Moodle and place it in your working directory 100. 00 9.4650 Write MATLAB program (298.m) to do the following in the specified order. 108. DECOP2.660 (4) Uwe MATLAB's isread command to read the participants and response tites in the file response tine.xlsx. Rand the data into mutrix RT. Do not type the values into the 110.000 11.750 Note that the values munbe calculated by your brands. Do not directly type in the values. The same applies to the following steps (s) Compute the average response time of each participant in Experiment 2 (that is, the average of responses in Test 3. Testand Test 5). Send output to the command window The average response time of each participant in pexit 2 tests are: 702. DECO (k) Sort the rows of the above matrix produced in Stepi)) according to the Experiment 2 response time in value-descending order, and display the sorted results as follows: v e Experiment 2 ugene tine in descending bes: 706.000 107.0. 108. DECO 10.6667 10.0963 103 110.DECO 12.7830 id) Centipute Pearson's cercato dicient between Text 1 and Test 2 responses. Dutput the computed correlation coefficient score to the command window: Correlation colliesent to eat and Ecot 2 is: 799.00C 3.505 3 967 703.000 , 105 1,7261 es. Dutput the le) Corpule Pear 's c smule corelat laim caefficient between Text 4 and Test 5 respons calicien seure to the e mand window 0.5801 (t) Compute the average response time of each participant in Experimenti (that is, the average of responses for each participant in Test and Test 2). Send output to the command winck response ise of each particians in Experiment 1 testa 104.09: 6 .6050 1.0233 il) Display the ID of the articipant who has the thesis a nd response time in Experiments follows: The participant with the fastest average Experiment i response time to (c) Compute the average response time of each participant in Experiment 2 (that is, the average of responses in Test Test 4, and Test 5). Send output to the command window: response time of each participant in Experiment 2 teatase: Obcain the answer i.e. 703) by extracting the relevant element from the sorted matrix. The same applies to the following step. 9.2803 Experiment 2 tests im) Display the ID of the participant who has the fastest avere response time as follows: 06.000 10.6667 The participant with the fastest average Experiment 2 response time : 730.003: 32.3803
Step by Step Solution
There are 3 Steps involved in it

Get step-by-step solutions from verified subject matter experts