

Question: Determining Velocity from Position-Time Graphs Last semester, in the laboratory, physics students were exploring graphs using a motion detector. One of the students started
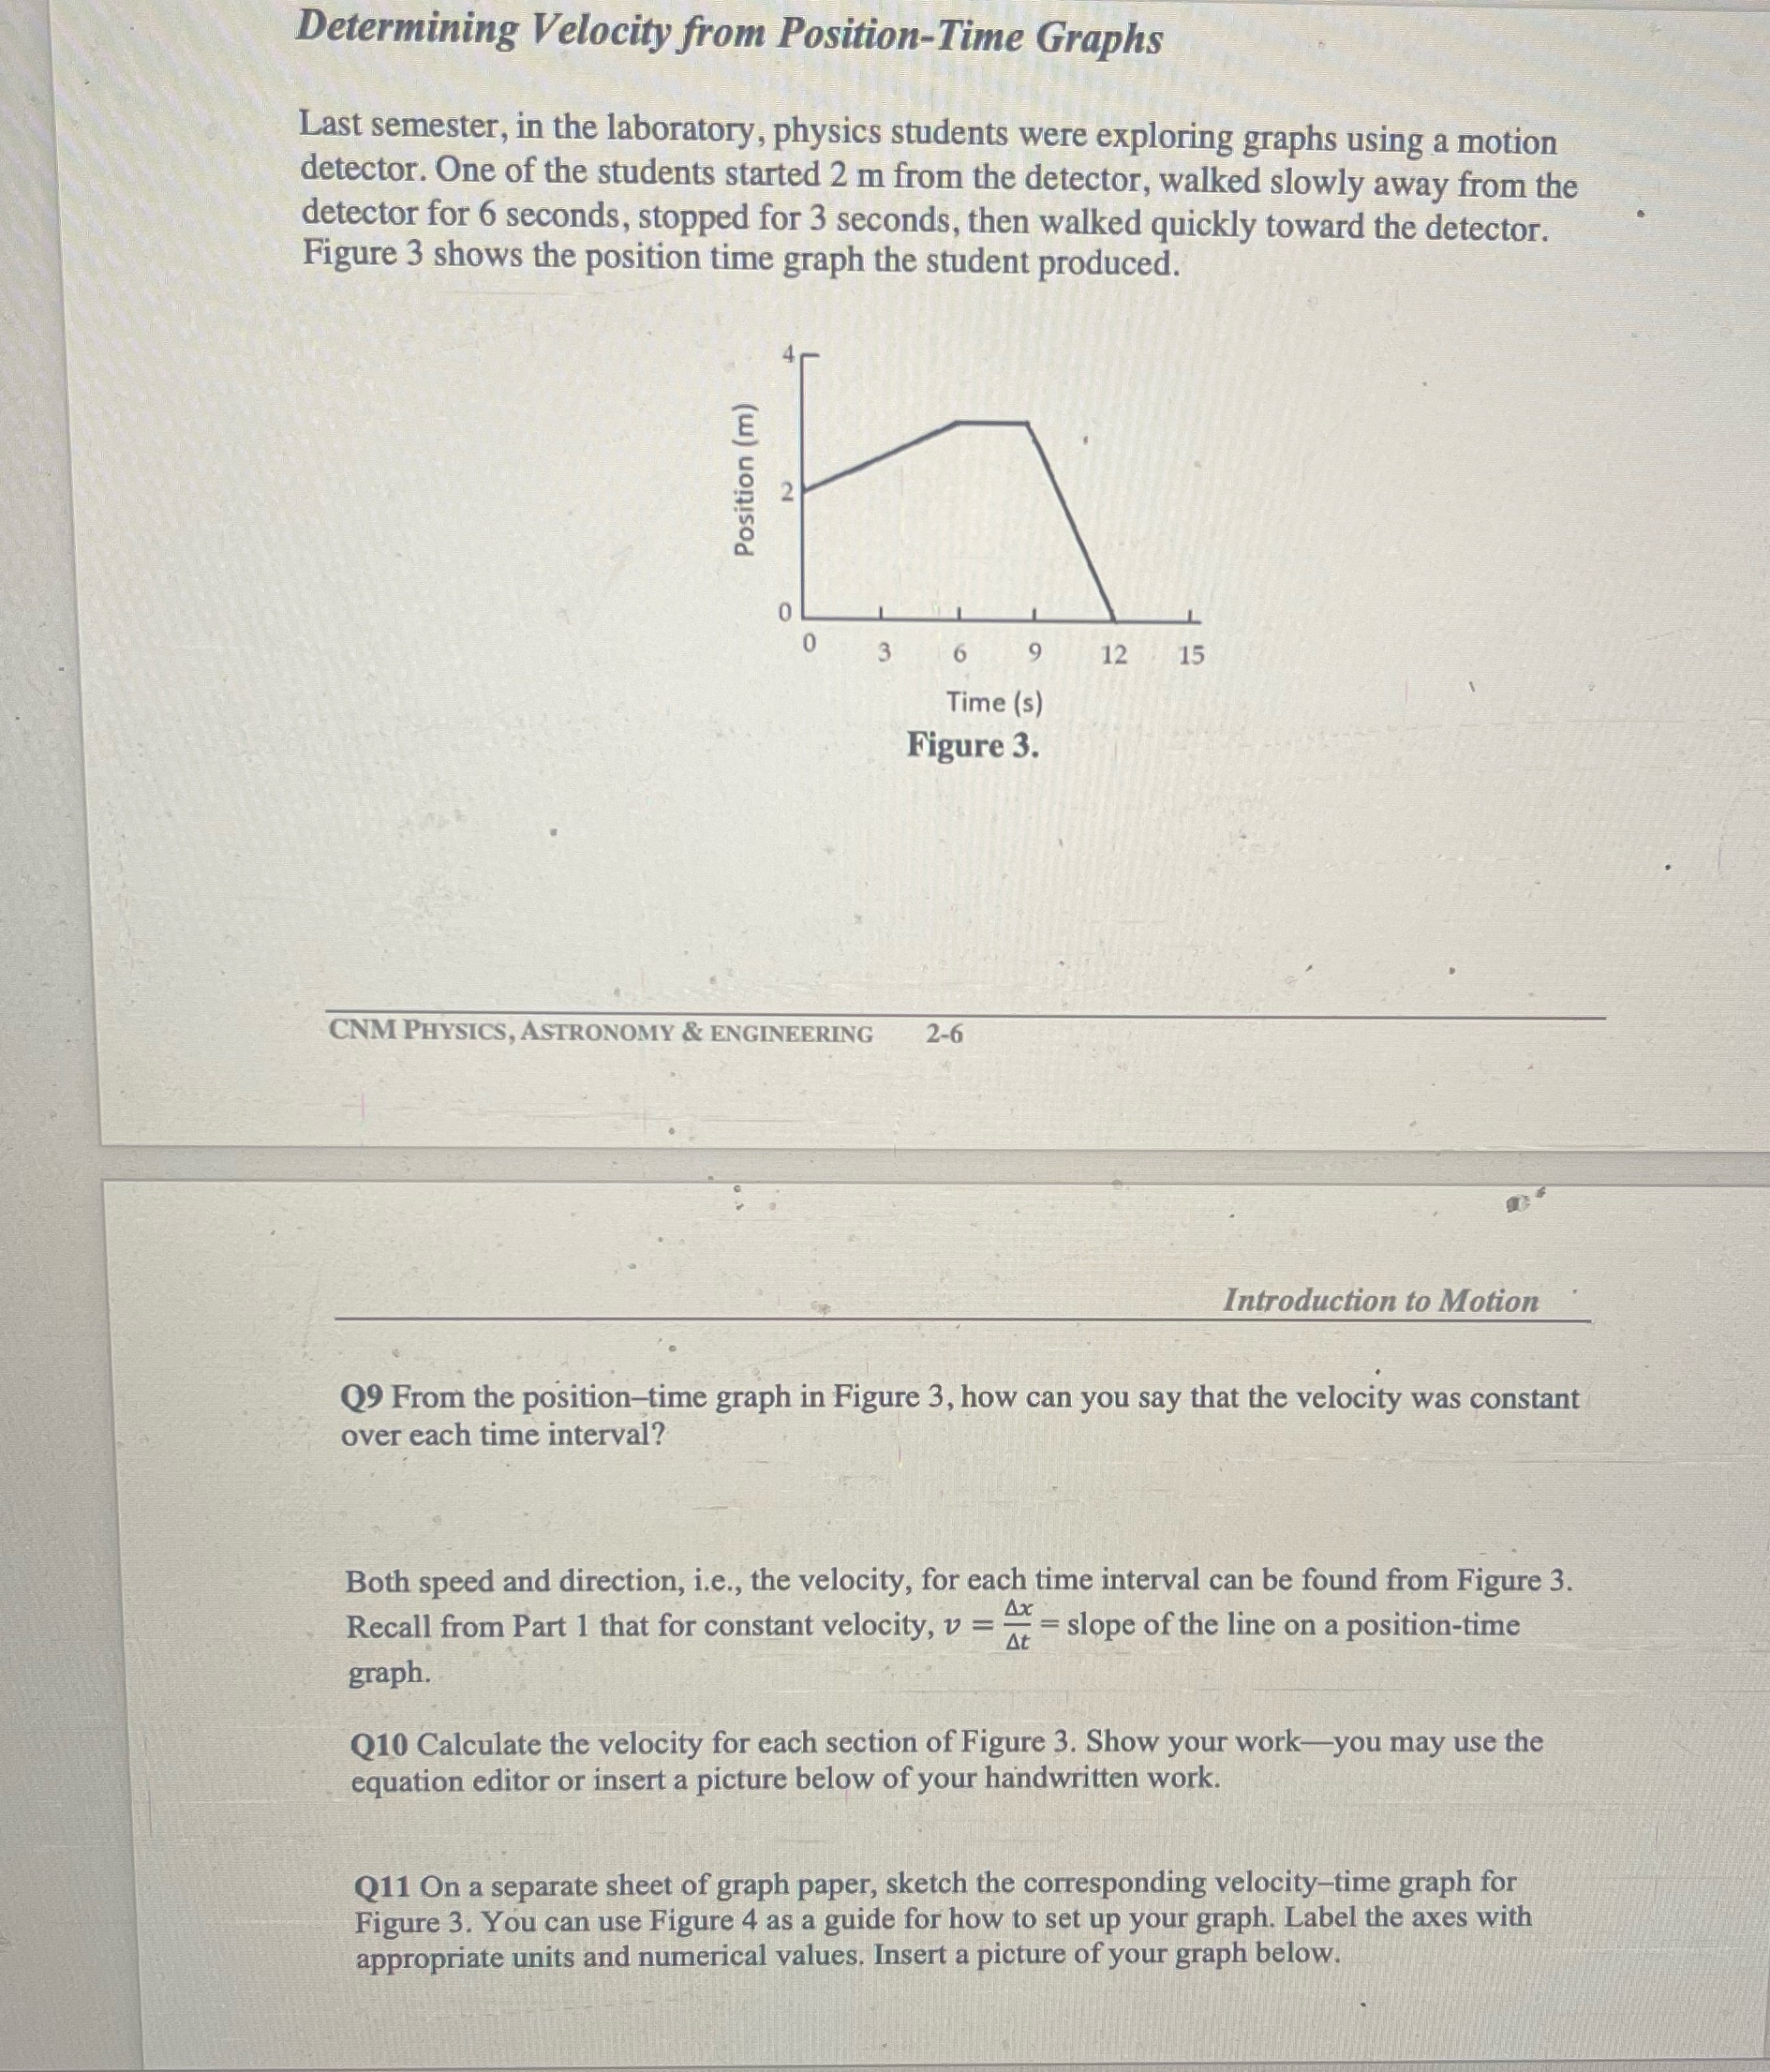
Determining Velocity from Position-Time Graphs Last semester, in the laboratory, physics students were exploring graphs using a motion detector. One of the students started 2 m from the detector, walked slowly away from the detector for 6 seconds, stopped for 3 seconds, then walked quickly toward the detector. Figure 3 shows the position time graph the student produced. Position (m) 2 0 3 6 9 Time (s) Figure 3. CNM PHYSICS, ASTRONOMY & ENGINEERING 2-6 12 12 15 Introduction to Motion Q9 From the position-time graph in Figure 3, how can you say that the velocity was constant over each time interval? Ax = At Both speed and direction, i.e., the velocity, for each time interval can be found from Figure 3. Recall from Part 1 that for constant velocity, v = slope of the line on a position-time graph. Q10 Calculate the velocity for each section of Figure 3. Show your work-you may use the equation editor or insert a picture below of your handwritten work. Q11 On a separate sheet of graph paper, sketch the corresponding velocity-time graph for Figure 3. You can use Figure 4 as a guide for how to set up your graph. Label the axes with appropriate units and numerical values. Insert a picture of your graph below.
Step by Step Solution
There are 3 Steps involved in it

Get step-by-step solutions from verified subject matter experts