

Answered step by step
Verified Expert Solution
Question
1 Approved Answer
please HW5: Create a Nave Bayes Classifier This homework gives you an opportunity to apply Bayes theorem to build a nave Bayes classifier for a
please 
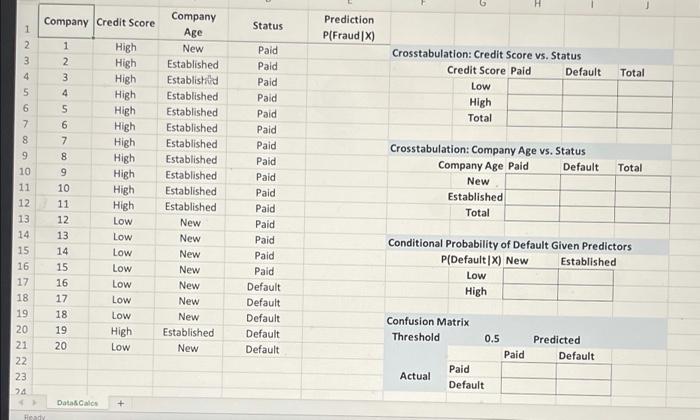
HW5: Create a Nave Bayes Classifier This homework gives you an opportunity to apply Bayes theorem to build a nave Bayes classifier for a dataset in Excel You are an analyst for a B2B firm and would like to predict which companies among your customers will default on their line of credit. You have historic data that includes the status of the companies (Paid or Default, target variable) and information about their credit score (Low or High) and the company age (New or Established). Complete the following tasks in Excel to create a classifier. a 1. (1 points) Create a cross-tabulation of the counts for each predictor variable vs. the target variable. 2. (1/2 point) Calculate the prior distribution of Paid and Default among the customers (ie. calculate Prob(Paid) and Prob(Default)). 3. (1/2 point) Calculate the conditional probabilities of each predictor variable given the status is "Paid." 4. (1 point) Calculate the conditional probabilities of each predictor variable given the status is "Default." 5. (2 points) Assuming the predictor variables are independent, calculate the conditional probability of default given each combination of x-variables. 6. (1 point) Use "if" statements in Excel to create a column that gives the conditional probability of default calculated by the nave Bayes classifier. 7. (2 point) Using a cutoff threshold of 0.5, create a confusion matrix of the classifier's performance. 8. (2 points) Calculate the overall accuracy, sensitivity (where you are trying to detect Default), and specificity of the classifier. Conduct the calculations in Excel, and turn in the Excel file. *For #7 and 8, you may wish to refer to the example file 6_LogReg_Choose Threshold.xlsx on Canvas for examples of how to implement the necessary formulas in Excel, H Company Credit Score Status Prediction P(Fraud x) 1 2 1 2 3 4 5 6 7 Nm Total Crosstabulation: Credit Score vs. Status Credit Score Paid Default Low High Total 8 9 10 3 4 5 6 7 8 9 10 11 12 13 14 15 16 Total Company Age New Established Establishild Established Established Established Established Established Established Established Established New New New New New New New Established New High High High High High High High High High High High Low Low Low Low Low Low Low High Low Crosstabulation: Company Age vs. Status Company Age Paid Default New Established Pald Paid Paid Paid Paid Paid Paid Paid Paid Paid Paid Paid Paid Paid Paid Default Default Default Default Default 11 12 13 14 15 16 17 18 19 20 21 22 23 74 Total Conditional Probability of Default Given Predictors P(DefaultIX) New Established Low High 17 18 19 20 Confusion Matrix Threshold 0.5 Paid Paid Actual Default Predicted Default DataCalce + Hey HW5: Create a Nave Bayes Classifier This homework gives you an opportunity to apply Bayes theorem to build a nave Bayes classifier for a dataset in Excel You are an analyst for a B2B firm and would like to predict which companies among your customers will default on their line of credit. You have historic data that includes the status of the companies (Paid or Default, target variable) and information about their credit score (Low or High) and the company age (New or Established). Complete the following tasks in Excel to create a classifier. a 1. (1 points) Create a cross-tabulation of the counts for each predictor variable vs. the target variable. 2. (1/2 point) Calculate the prior distribution of Paid and Default among the customers (ie. calculate Prob(Paid) and Prob(Default)). 3. (1/2 point) Calculate the conditional probabilities of each predictor variable given the status is "Paid." 4. (1 point) Calculate the conditional probabilities of each predictor variable given the status is "Default." 5. (2 points) Assuming the predictor variables are independent, calculate the conditional probability of default given each combination of x-variables. 6. (1 point) Use "if" statements in Excel to create a column that gives the conditional probability of default calculated by the nave Bayes classifier. 7. (2 point) Using a cutoff threshold of 0.5, create a confusion matrix of the classifier's performance. 8. (2 points) Calculate the overall accuracy, sensitivity (where you are trying to detect Default), and specificity of the classifier. Conduct the calculations in Excel, and turn in the Excel file. *For #7 and 8, you may wish to refer to the example file 6_LogReg_Choose Threshold.xlsx on Canvas for examples of how to implement the necessary formulas in Excel, H Company Credit Score Status Prediction P(Fraud x) 1 2 1 2 3 4 5 6 7 Nm Total Crosstabulation: Credit Score vs. Status Credit Score Paid Default Low High Total 8 9 10 3 4 5 6 7 8 9 10 11 12 13 14 15 16 Total Company Age New Established Establishild Established Established Established Established Established Established Established Established New New New New New New New Established New High High High High High High High High High High High Low Low Low Low Low Low Low High Low Crosstabulation: Company Age vs. Status Company Age Paid Default New Established Pald Paid Paid Paid Paid Paid Paid Paid Paid Paid Paid Paid Paid Paid Paid Default Default Default Default Default 11 12 13 14 15 16 17 18 19 20 21 22 23 74 Total Conditional Probability of Default Given Predictors P(DefaultIX) New Established Low High 17 18 19 20 Confusion Matrix Threshold 0.5 Paid Paid Actual Default Predicted Default DataCalce + Hey Step by Step Solution
There are 3 Steps involved in it
Step: 1

Get Instant Access to Expert-Tailored Solutions
See step-by-step solutions with expert insights and AI powered tools for academic success
Step: 2

Step: 3
Ace Your Homework with AI
Get the answers you need in no time with our AI-driven, step-by-step assistance
Get Started
Finance And Modernization
Authors: Gerald D. Feldman, Peter Hertner
1st Edition
0754662713, 978-0754662716