All Matches
Solution Library
Expert Answer
Textbooks
Search Textbook questions, tutors and Books
Oops, something went wrong!
Change your search query and then try again
Toggle navigation
FREE Trial
S
Books
FREE
Tutors
Study Help
Expert Questions
Accounting
General Management
Mathematics
Finance
Organizational Behaviour
Law
Physics
Operating System
Management Leadership
Sociology
Programming
Marketing
Database
Computer Network
Economics
Textbooks Solutions
Accounting
Managerial Accounting
Management Leadership
Cost Accounting
Statistics
Business Law
Corporate Finance
Finance
Economics
Auditing
Hire a Tutor
AI Study Help
New
Search
Search
Sign In
Register
study help
business
microsoft excel data analysis 7th
Questions and Answers of
Microsoft Excel Data Analysis 7th
2. 7 Determine a basis for ilie space W c \R 4 spanned by the four vectors
2.14 Using the Gram-Schmidt technique, construct an orthonormal basis for the subspace of !11 4 defmed by the vectors
2.13 Construct an oriliogonal basis of ilie space spanned by ilie set of vectors
2.12 If it is known iliat a valid basis for ilie space of polynomials of degree less ilian or equal to three is {1, t, t2, t3}, show that every such polynomial has a unique representation as
2.11 Prove or disprove ilie following statement: If {v1,v2,v3,v4} is a basis for ilie vector space \R 4 and W is a subspace of \R 4 ilien some subset of{v1,v2,v3,v4} formsabasisforW.
2.10 For ilie following matrices, find ilie ranks and degeneracies. I 2 -3] a) -2 2 4 1 2 [0 2 0] b) 200 [1 6 3 2 -2 c) 2 12 4 6 -10 020 3 18 0 15 -15 -15]
2.9 Prove iliat ilie number of linearly independent rows in a matrix is equal to ilie number of lirlearly independent columns.
2.8 Prove iliat ilie number of linearly independent rows in a matrix is equal to ilie number of lirlearly independent columns.For ilie following matrices, find ilie ranks and degeneracies.
2.15 Let C4 denote the space of all complex 4-tuples, over the complex numbers. Use the "standard" inner product and the Gram-Schmidt method to orthogonalize the vectors
2.25 Let V be the linear space of real-valued continuous functions defined on the interval t E [ -1, 1] , with inner product(f,g)= tt(x)g(x) dx Let W be a subspace consisting of polynomials p of
2.24 Let V be the space of all polynomials with real coefficients, with the inner product J., 2 (f,g)= -
2.22 Use the complex vector x = [1 + 2i 2- i]T to demonstrate that, in a complex vector space, ( x, y) = x T y is not a valid inner product.v2.23 Find the polynomial p(t) = t3 + a2t2 + a1t + a0 for
2.21 Let V be an inner product space. If x,y eV, and (x,z)=(y,z) for every z E V , prove that x = y .
2.20 Let V be the vector space of continuous real-valued functions oft defmed on the interval t e [0, 3] . Let W be the subspace of V consisting of functions that are linear for 0 < t < 1 , linear
2.19 The LeGendre polynomials may be defined as the orthogonalization of the basis {1, t, t2, ••• } for the space of polynomials in t, defined on t e [ -1, 1] , using the inner product I(!,g)=
2.17 Let l4x if 0 ~ x ~ 015 fi(x)= 2-4x if015
2.16 Consider the vector y = [ 1 2 3 ]r . Find the orthogonal projection of y onto the plane x1 - 2x2 + 4x3 = 0 .
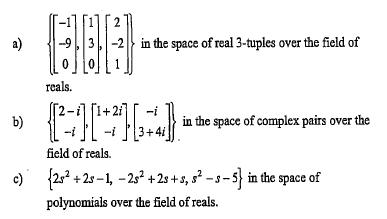
2.5 Which of the following sets of vectors are linearly independent?Prove or disprove ilie following claims: if u, v, and w are linearly independent in vector space V, ilien so area) u, u + v, and u
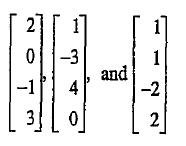
2.4 Are the following vectors in \R4 linearly independent over the reals? -3 1 and -1 4 -2 0 2
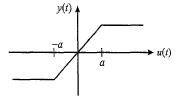
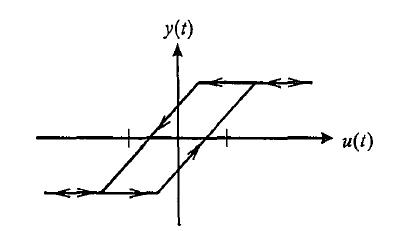
1.1 A system has an input u(t) and an output y(t) , which are related by the information provided below. Classify each system as linear or nonlinear and time-invariant or time-varying.a) y(t) = 0
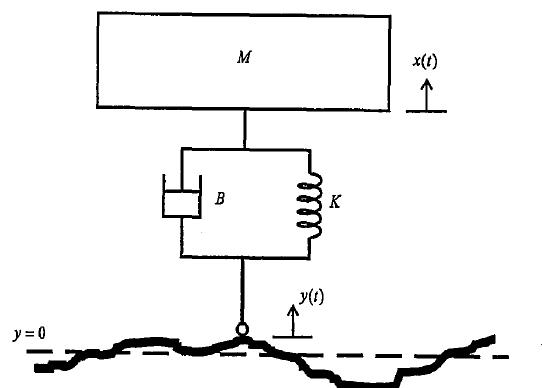
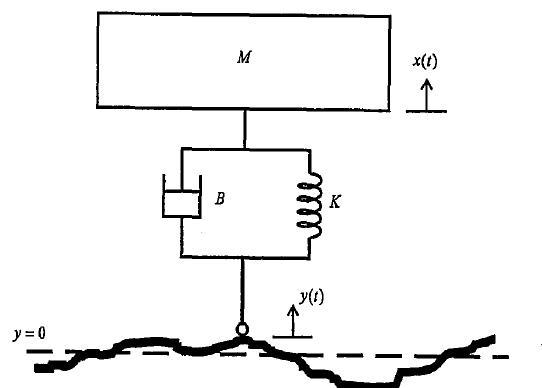
1.2 Figure P1.2 shows a model co=only used for automobile suspension analysis. In it, the uneven ground specifies the position of the wheel's contact point The wheel itself is not shown, as its mass
1.3 The motor in Figure P1.3 exerts a torque 1: on the shaft of a motor, which has inertia Jm and bearing friction Bm (assumed viscous). This motor is attached to a load inertia J L , which itself
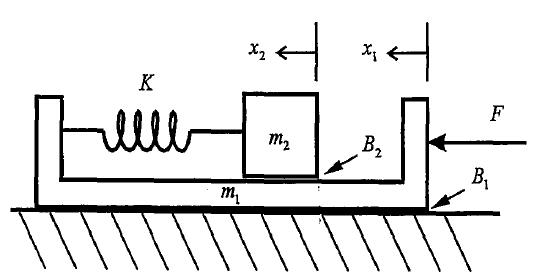
1.4 For the mechanical system in Figure P1.4 with a spring, friction forces, and an external force, write state equations using the following sets of variables:a) State variables ~I =XI, ~2 =XI, ~3 =
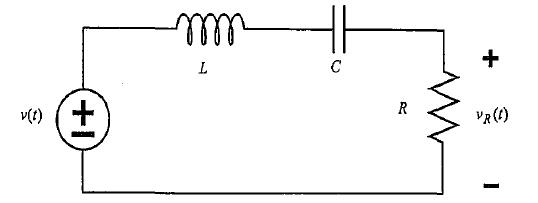
1.5 For the circuit shown in Figure Pl.5, choose appropriate state variables and write state equations, taking as output the voltage across the resistor. - T + (2) P C + VR()
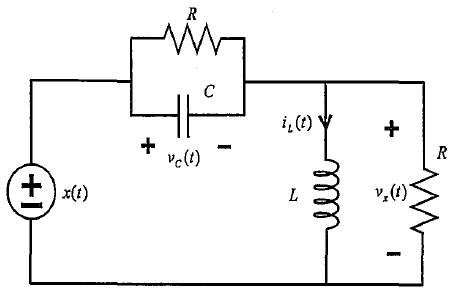
1.6 For the circuit shown in Figure P1.6, write a single second-order differential equation in terms of the voltage vx(t) and the input x(t).Then write state equations using state variables vc(t) and
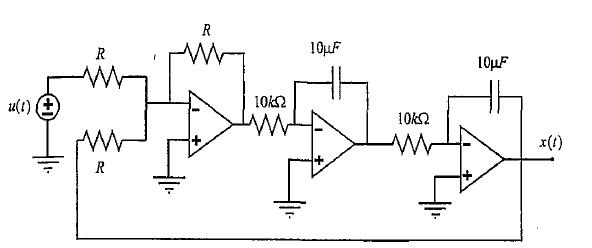
1.7 For the circuit shown in Figure P1.7, with ideal OP-AMPS, find a state variable representation, using the capacitor voltages as state variables, and the signal x(t) as the output. What will be
1.8 Write two differential equations that describe the behavior of the circuit of Example 1.2, using vL(t) and vc(t) as the state variables.Example 1.2,1.2 Figure P1.2 shows a model co=only used for
1.10 For the state variable description of the system in terms of x,(t), [(t)] [18 X(1) 50 23 9 13x(t)] 35 2(t) +0 u(t) [*3 (4)] -65 -31 -46x3(1)] [x (1)] y(t) [555](t) [x3 (1)] change the state
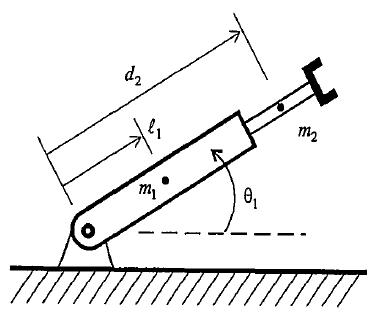
1.11 The robot shown in Figure P 1.11 has the differential equations of motion given. Symbols m1 ,~,11 ,12,£1 , and g are constant parameters, representing the characteristics of the rigid body
1.12 For the system in Example 1.8, the nonlinear equations of motion are given in {1.58). Show that (1.60) is the linear approximation of the second of these equations, and combine the two
1. The permanent magnet dc motor is depicted diagrammatically in Fig. 1, in which the input voltage e, is applied to the armature circuit. The resulting armature current produces the driving torque
2.1 The set W of n x n matrices with real entries is known to be a linear vector space. Determine which of the following sets are subspaces ofW:a) The set of n x n skew-symmetric matrices?b) The set
1.9 Given the state variable description of the system in terms of xi(t)below, change the state variables and write new state equations for the variables ~1 (t) = 3x1(t)+ 2x2(t), and ~ 2 (t) = 7x1
2.2 Consid~r the set of all polynomials in s of degree less than or equal to four, With real coefficients, with the conditions:p'(O)+p(O)=O p(l) = 0 Show that this set is a linear vector space, and
2.3 For Example 2.4 on page 54 where we tested the linear independence of vectors of rational polynomials, show that indeed, if a1 and a2 are real, then they must both be zero.
2.18 Let V be the vector space of all polynomials, with inner product(!,g)= J0"' f(x)g(x)e-x dx Let W be the subspace ofV spanned by {1, x, x2}.a) Use Gram-Schmidt to orthogonalize {1, x, x2}.b) Find
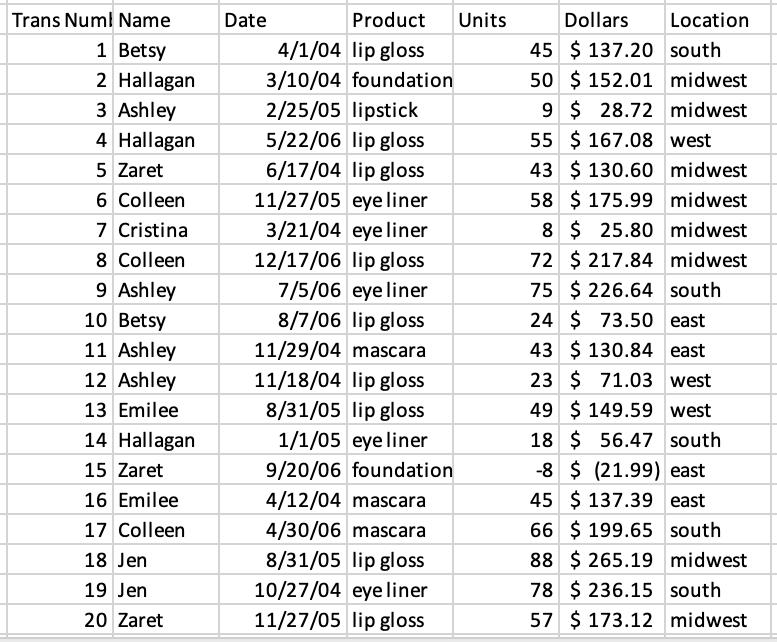
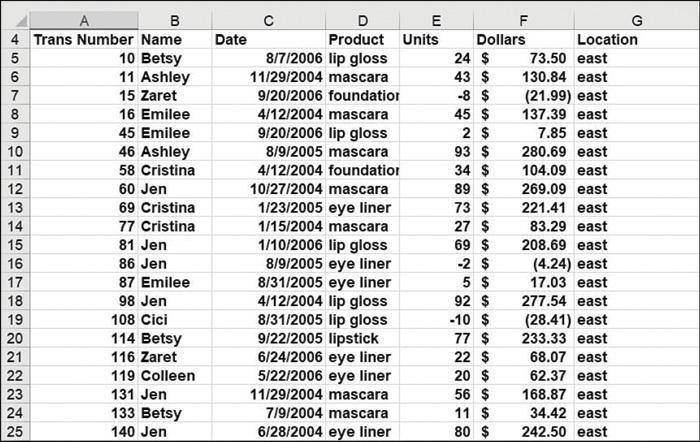
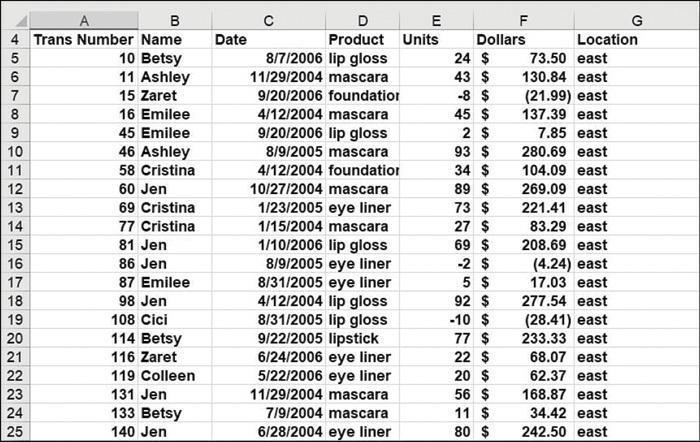
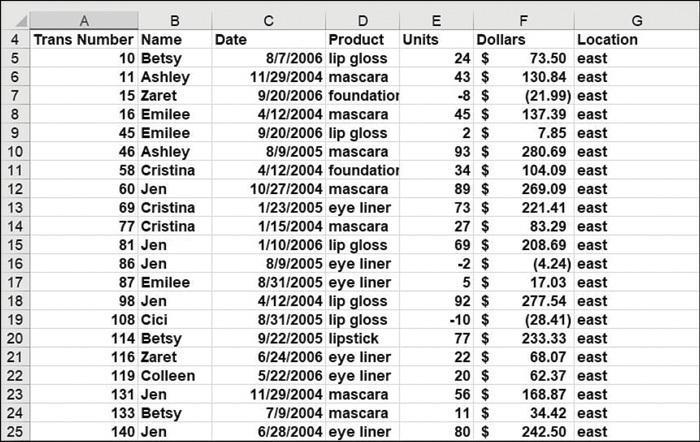
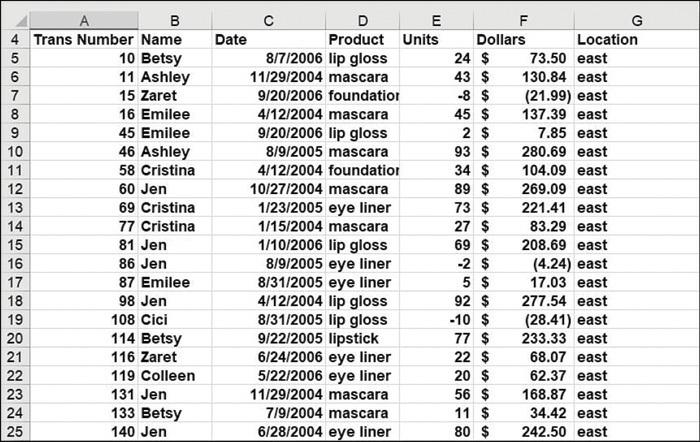
The file named Makeupdb.xlsx contains information about the sales of makeup products. For each transaction, you are given the following information:Name of salespersonDate of saleProduct soldUnits
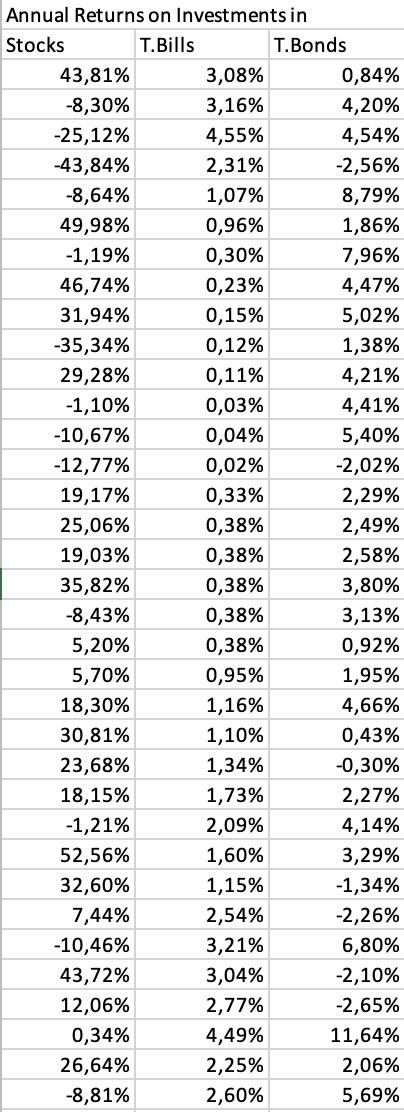
The Problem 3 worksheet contains annual returns on stocks, T-bills, and T-bonds. Find and interpret the correlations between each pair of the annual returns on these three classes of investments.Run
The Problem 2 worksheet contains the daily sales volume (in dollars) of laser printers, printer cartridges, and school supplies. Find and interpret the correlations between each pair of these
The Problem 1 worksheet contains the number of cars parked each day in the outdoor lot and in the parking garage near the Indiana University Kelley School of Business. Find and interpret the
You are given the monthly level of the Dow Jones Industrial Average Index for the years 1947 through 1992. Does this data indicate any unusual seasonal patterns in stock returns?
You have a $100,000 expense budget. In column A, you enter expenses as they are incurred. Set up data validation to ensure that the total expenses listed in column E do not exceed your budget.
In the customer PivotTable example, show the top 15 customers in one table and the bottom five customers in another table.
From the chip PivotTable example, create a new PivotTable that summarizes the monthly sales of Chips 1 and 3 in France and the United States.
For the data in the file named Calcitemdata.xlsx, create calculated fields that summarize the sales of dessert (cakes+puddings) and fruits (apples+grapes).
For the grocery example, create a PivotChart that summarizes the sales of each product at each store for the years 2005 and 2006.
For the grocery example, create a calculated field that computes an average per-unit price received for each product.
For the grocery example, prepare a chart that summarizes the trend over time of the sales at each store.
For the years 1985–1992, you are given monthly interest rates on bonds that pay money one year after the day they’re bought. It’s often suggested that interest rates are more volatile— that
The file named Ptablepartsdata.xlsx contains sales of various parts. Each part’s code begins with either Part (for computer part) or Comp (for computer). Create a PivotTable that shows only the
The file named Analyzesurveydata.xlsx contains answers on a 1–7 scale to various questions on a teaching evaluation survey. Create a PivotChart that charts for each question the fraction of the
The file named Collegedata.xlsx tells you the following information about students who applied to graduate school at Kelley School of Business:Gender Desired major
The file named Cigarettedata.xlsx contains the age of a sample of Americans, whether they smoke cigarettes or cigars, and whether they died during the current year. What can you conclude from this
For the data in Problem 14, summarize the total sales of parts and computers.Data from in problem 14The file named Ptablepartsdata.xlsx contains sales of various parts. Each part’s code begins with
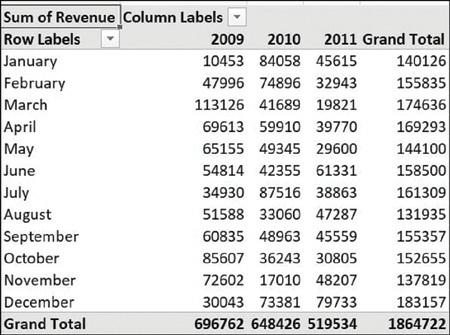
Using the data in the file named Monthtomonth.xlsx, create a PivotTable that shows for the year 2010 how each month’s sales differ from the previous month. Sum of Revenue Column Labels Row
The file named Problem27data.xlsx contains daily Bitcoin prices. Create a PivotTable that summarizes daily returns by year and another PivotTable that summarizes daily returns by day of the week. For
The file named Problem26data.xlsx gives sales information for a department store chain. The tax rate for each state is given, and no tax is paid on non-profit sales. Create a PivotTable that shows
The file named Problem25data.xlsx contains data on 2016 NBA players. A player’s effective field goal percentage (EFG) is computed as EFG=(FG+.5*3P)/FGA, where FG equals field goals made, 3P equals
The file named Problem24data.xlsx contains position and salary data for 2016 Carolina Panthers NFL players. Create a drop-down menu from which a player can be selected. Then create formulas that show
The state of Happyland has nine congressional districts. In the file named Problem23data.xlsx, you are given a voter’s district and whether the voter is a Democrat or Republican. Construct a
The file named Problem22data.xlsx contains information on births during 1995 at Dylan General Hospital. Construct a PivotChart that summarizes the births by day of the week. Then use another
In the file named Problem21data.xlsx, you are given the following information about a representative sample of US residents:Whether they subscribe to Garden and Gun magazineIncome level (low, middle,
More than 1,000 registered voters were asked their political orientation (liberal, moderate, or conservative) and whether they favored the Dream Act. Using the data in the file named
The workbook Gamestop.xlsx contains daily closing prices and returns for GameStop stock. Use a PivotTable to compute the average return for each year/month combination. (Look at early 2021!) Also,
The file named Faberu.xlsx contains salaries, travel expenses, faculty ID, department code, and faculty code for all the business-school faculty. Use this data to answer the following questions.Use
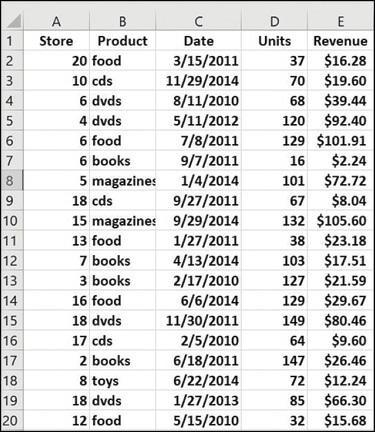
Using the file States.xlsx (in the Templates folder), summarize the total sales in each state by year. 1 23 3456780 9 10 11 12 13 14 15 16 17 18 19 20 A Store B Product 20 food 10 cds 6 dvds 4 dvds 6
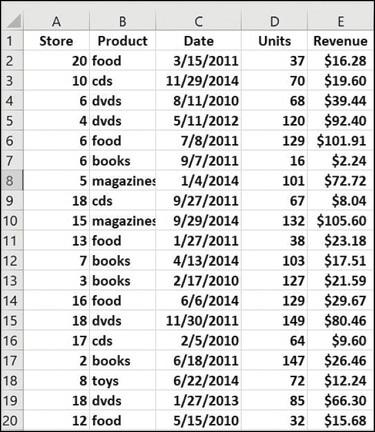
Using the named Storesales.txt, summarize the total revenue by store, and create a slicer for the Store field. 1 23 3456780 9 10 11 12 13 14 15 16 17 18 19 20 A Store B Product 20 food 10 cds 6
You can find the data for this chapter’s problems in the file Makeupsubtotals.xlsx. Use the Subtotal command for the following computations: Create a consolidated worksheet that gives the
You can find the data for this chapter’s problems in the file Makeupsubtotals.xlsx. Use the Subtotal command for the following computations:Create a consolidated worksheet that gives the largest
You can find the data for this chapter’s problems in the file Makeupsubtotals.xlsx. Use the Subtotal command for the following computations:Use a SUBTOTAL formula to determine the total number of
Use the data in the Dowdata.xlsx file to create each of the four types of stock charts.
Use the data in the Diner.xlsx file to create a sunburst chart that summarizes restaurant sales.
The Diner.xlsx file contains information about lunch and breakfast sales at Mel’s Diner. Create a treemap chart to summarize this sales data. Hint: You will need to aggregate the data.
The file Crimedata.xlsx contains annual rates of violent crimes, property crimes, and murders in the United States. Create a graph showing the number of crimes each year. Use check boxes to control
The Indiana University basketball team considers at least 50 deflections per game a good performance and 30 or fewer deflections a poor performance. In the last six games, Indiana had 25, 55, 45, 43,
The Mavsscores.xlsx workbook contains the Dallas Mavericks’ margin of victory (a number < 0 indicates a loss) in 17 games. Graph the Mavs’ margin of victory. Make sure your chart labels each
The Monthlysales.xlsx workbook contains monthly sales at a local restaurant along with quarterly sales totals. Graph the data first with the quarterly totals and then without the quarterly
The Sports.xlsx workbook contains sales by sport at your local sporting-goods store for the years 2021 through 2024. Summarize this data with three different stacked area charts and a line chart.
The Sports.xlsx workbook contains sales by sport at your local sporting-goods store for the years 2021 through 2024. Summarize this data with three different column charts.
The Sportinglife.xlsx workbook contains this year’s sales revenue for each sport at your local sporting-goods store. Summarize this data with a bar of pie chart, where all sports generating at most
Rescale the vertical axis in Problem 9 in multiples of 100,000.Data from in problem 9The COVIDcases.xlsx workbook contains for each date the number of US inhabitants diagnosed with COVID-19 by that
Analyzing COVID19 Dataset You are given a dataset in relation to COVID19 record up to July 2020 (covid19_July2020_dataset.xlsx). The dataset contains data such as country name, region, population,
The Galton.xlsx workbook contains the heights of fathers and their sons. Summarize this data in a scatter chart with appropriately labeled axes.
In the file Hiddenpivot.xlsx, filter the data so that only 2013 sales appear in the spreadsheet, but all the data appears in the chart.
Use the data in the Bubbledata.xlsx workbook to construct a bubble chart with labels that, for five companies, summarize their number of products, their sales, and their percentage of market share.
The Cakes.xlsx file contains for each month the number of salespeople and revenue for a bakery.Graph the number of salespeople and insert a data table below the chart.
The Cakes.xlsx file contains for each month the number of salespeople and revenue for a bakery.Plot monthly sales using a cake image for the columns rather than a column chart.
The Cakes.xlsx file contains for each month the number of salespeople and revenue for a bakery.Graph monthly revenue and insert data labels on the chart.
The Cakes.xlsx file contains for each month the number of salespeople and revenue for a bakery.Create a combination chart with a secondary axis to summarize the monthly number of salespeople and
The Electoralvotes.xlsx file contains each state’s (and the District of Columbia’s) number of members in the House of Representatives and Senate. Create a 3D map stacked column chart that shows
The Top20.xlsx file contains the population of the 20 largest US cities. Create a 3D map bubble chart that displays this population data.
Use the data in the Seattle.xlsx file to create a map for which the height of each column represents the average inspection score in each city.
Set up a spreadsheet that can be used to create a 3D map showing product sales for Bloomington, Indiana; Bloomington, Illinois; and Bloomington, Minnesota.
The Stateincome.xlsx file contains median income by state for the year 2010. Create a 3D map that summarizes this data.
The Cellphonedata.xlsx file contains the population and number of cell phones for the 20 countries/regions having the most cell phones.Create a 3D map with columns that summarizes cell phones by
The Cellphonedata.xlsx file contains the population and number of cell phones for the 20 countries/regions having the most cell phones.Create a filled map that summarizes cell phones by
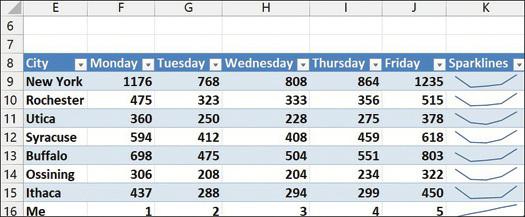
For the bank branch data, make your line sparklines use the same scale for each branch. 879 6 E 8 City 9 New York 10 Rochester 11 Utica 12 Syracuse 13 Buffalo 14 Ossining 15 Ithaca 16
Showing 1 - 100
of 914
1
2
3
4
5
6
7
8
9
10