New Semester
Started
Get
50% OFF
Study Help!
--h --m --s
Claim Now
Question Answers
Textbooks
Find textbooks, questions and answers
Oops, something went wrong!
Change your search query and then try again
S
Books
FREE
Study Help
Expert Questions
Accounting
General Management
Mathematics
Finance
Organizational Behaviour
Law
Physics
Operating System
Management Leadership
Sociology
Programming
Marketing
Database
Computer Network
Economics
Textbooks Solutions
Accounting
Managerial Accounting
Management Leadership
Cost Accounting
Statistics
Business Law
Corporate Finance
Finance
Economics
Auditing
Tutors
Online Tutors
Find a Tutor
Hire a Tutor
Become a Tutor
AI Tutor
AI Study Planner
NEW
Sell Books
Search
Search
Sign In
Register
study help
business
statistics alive
Statistics The Art And Science Of Learning From Data 4th Global Edition Alan Agresti, Christine A. Franklin, Bernhard Klingenberg - Solutions
Critical Thinking Suppose you wanted to conduct a statistical test to determine whether the number of adults who still subscribe to cable has decreased from 60%. Based on this information, would you conduct a statistical test for m or p? Explain.AppendixLO1
Critical Thinking Suppose you wanted to conduct a statistical test to determine if the average amount of time an adult spends on their smart phone has increased from 4 hours. Based on this information, would you conduct a statistical test for m or p? Explain.AppendixLO1
Critical Thinking A study was conducted to determine whether the majority of students attending college receive in-state tuition. Based on this information, what would be the null and alternative hypotheses for this study if you were to conduct a statistical test?Explain.AppendixLO1
Critical Thinking An article in a newspaper states that the proportion of traffic accidents involving road rage is higher this year than it was last year, when it was 15%. Reconstruct the information of the study in terms of a hypothesis test. Discuss possible hypotheses, possible issues about the
Critical Thinking In general, if sample data are such that the null hypothesis is rejected at the a 51%level of significance based on a two-tailed test, is H0 also rejected at the a 51% level of significance for a corresponding one-tailed test? Explain.AppendixLO1
Statistical Literacy Consider a binomial experiment with n trials and r successes. For a test for a proportion p, what is the formula for the z value of the sample test statistic? Describe each symbol used in the formula.AppendixLO1
Statistical Literacy To use the normal distribution to test a proportion p, the conditions np . 5 and nq . 5 must be satisfied. Does the value of p come from H0, or is it estimated by using ˆp from the sample?AppendixLO1
Conclude a statistical test for one proportion.AppendixLO1
Compute the P-value for a one proportion statistical test.AppendixLO1
Compute the sample test statistic for a one proportion statistical test.AppendixLO1
Identify the components needed for testing a proportion.AppendixLO1
Critical Region Method: Student’s t Solve Problem 22 using the critical region method of testing. Hint:See Problem 36. Compare your conclusion with the conclusion obtained by using the P-value method. Are they the same?AppendixLO1
Critical Region Method: Student’s t Solve Problem 21 using the critical region method of testing. Hint:See Problem 36. Compare your conclusion with the conclusion obtained by using the P-value method. Are they the same?AppendixLO1
Critical Region Method: Student’s t Table 6 of Appendix II gives critical values for the Student’s t distribution. Use an appropriate d.f. as the row header.For a right-tailed test, the column header is the value of a found in the one-tail area row. For a left-tailed test, the column header is
Critical Region Method: Standard Normal Solve Problem 19 using the critical region method of testing(i.e., traditional method). Compare your conclusion with the conclusion obtained by using the P-value method. Are they the same?AppendixLO1
Confidence Intervals and Two-Tailed Hypothesis Tests Change the null hypotheses of Problem 33 to H0 : m 5 21 and H1: m ? 21. Repeat parts (a) and (b).AppendixLO1
Expand Your Knowledge: Confidence Intervals and Two-Tailed Hypothesis Tests Is there a relationship between confidence intervals and two-tailed hypothesis tests? Let c be the level of confidence used to construct a confidence interval from sample data. Let a be the level of significance for a
Critical Thinking: Comparing Hypothesis Tests with U.S. Courtroom System Compare statistical testing with legal methods used in a U.S. court setting.Then discuss the following topics in class or consider the topics on your own. Please write a brief but complete essay in which you answer the
Critical Thinking: One-Tailed versus Two-Tailed Tests(a) For the same data and null hypothesis, is the P-value of a one-tailed test (right or left) larger or smaller than that of a two-tailed test? Explain.(b) For the same data, null hypothesis, and level of significance, is it possible that a
Archaeology: Tree Rings Tree-ring dating from archaeological excavation sites is used in conjunction with other chronologic evidence to estimate occupation dates of prehistoric Indian ruins in the southwestern United States.It is thought that Burnt Mesa Pueblo was occupied around 1300 a.d. (based
Fishing: Atlantic Salmon Homser Lake, Oregon, has an Atlantic salmon catch and release program that has been very successful. The average fisherman’s catch has been m 5 8.8 Atlantic salmon per day (Source:National Symposium on Catch and Release Fishing, Humboldt State University). Suppose that a
Longevity: Honolulu USA Today reported that the state with the longest mean life span is Hawaii, where the population mean life span is 77 years. A random sample of 20 obituary notices in the Honolulu Advertizer gave the following information about life span (in years) of Honolulu residents:72 68
Ski Patrol: Avalanches Snow avalanches can be a real problem for travelers in the western United States and Canada. A very common type of avalanche is called the slab avalanche. These have been studied extensively by David McClung, a professor of civil engineering at the University of British
Medical: Hemoglobin Count Let x be a random variable that represents hemoglobin count (HC)in grams per 100 milliliters of whole blood. Then x has a distribution that is approximately normal, with population mean of about 14 for healthy adult women (see reference in Problem 25). Suppose that a
Medical: Red Blood Cell Count Let x be a random variable that represents red blood cell (RBC) count in millions of cells per cubic millimeter of whole blood.Then x has a distribution that is approximately normal.For the population of healthy female adults, the mean of the x distribution is about
Agriculture: Ground Water Unfortunately, arsenic occurs naturally in some ground water (Reference:Union Carbide Technical Report K/UR-1). A mean arsenic level of m 5 8.0 parts per billion (ppb) is considered safe for agricultural use. A well in Texas is used to water cotton crops. This well is
Investing: Stocks Socially conscious investors screen out stocks of alcohol and tobacco makers, firms with poor environmental records, and companies with poor labor practices. Some examples of “good,” socially conscious companies are Johnson and Johnson, Dell Computers, Bank of America, and
Fishing: Trout Pyramid Lake is on the Paiute Indian Reservation in Nevada. The lake is famous for cutthroat trout. Suppose a friend tells you that the average length of trout caught in Pyramid Lake is m 519 inches. However, the Creel Survey(published by the Pyramid Lake Paiute Tribe Fisheries
Wildlife: Coyotes A random sample of 46 adult coyotes in a region of northern Minnesota showed the average age to be x 5 2.05 years, with sample standard deviation s 5 0.82 years (based on information from the book Coyotes: Biology, Behavior and Management by M. Bekoff, Academic Press). However, it
Medical: Blood Plasma Let x be a random variable that represents the pH of arterial plasma (i.e., acidity of the blood). For healthy adults, the mean of the x distribution is m 5 7.4 (Reference: The Merck Manual, a commonly used reference in medical schools and nursing programs). A new drug for
Meteorology: Storms Weatherwise is a magazine published by the American Meteorological Society.One issue gives a rating system used to classify Nor’easter storms that frequently hit New England and can cause much damage near the ocean. A severe storm has an average peak wave height of m 516.4
Academic: Spending Being a college student is not an easy financial endeavor. In addition to paying for tuition, students also need to pay for rent, food, utilities, etc. This does not even include nonessential discretionary spending. One study claimed that college students spend, on average, m
Gaming: In-game Purchases One way developers continue to make money off their consumers for freeto-play games is through in-game purchases such as character skins, emotes, accessories, etc. One study claimed that, on average, players spend around $205 a year on in-game purchases. To determine if
Basic Computation: Testing m, s Unknown A random sample has 49 values. The sample mean is 8.5 and the sample standard deviation is 1.5. Use a level of significance of 0.01 to conduct a left-tailed test of the claim that the population mean is 9.2.(a) Check Requirements Is it appropriate to use a
Basic Computation: Testing μ, s Unknown A random sample of 25 values is drawn from a moundshaped and symmetric distribution. The sample mean is 10 and the sample standard deviation is 2. Use a level of significance of 0.05 to conduct a two-tailed test of the claim that the population mean is
Basic Computation: P-value Corresponding to t Value For a Student’s t distribution withd. f . 516 and t 521.830,(a) find an interval containing the corresponding P-value for a two-tailed test.(b) find an interval containing the corresponding P-value for a left-tailed test.AppendixLO1
Basic Computation: P-value Corresponding to t Value For a Student’s t distribution withd. f . 510 and t 5 2.930,(a) find an interval containing the corresponding P-value for a two-tailed test.(b) find an interval containing the corresponding P-value for a right-tailed test.AppendixLO1
Critical Thinking Consider a test for m. When conducting the critical region method you noticed that the sample test statistic z fell within the critical region at the 5% level of significance. If you were to compute the P-value for the test statistic, would it be greater than or less than 5%?
Critical Thinking Consider a test for m. If the P-value is such that you reject H0 at the 5% level of significance, then if you used the critical region method would the sample test statistic z fall within the critical region? Explain.AppendixLO1
Critical Thinking If sample data is such that for a one-tailed test of m you can reject H0 at the 1% level of significance, can you always reject H0 for a two-tailed test at the same level of significance? Explain.AppendixLO1
Critical Thinking Consider a test for m. If the P-value is such that you can reject H0 for a 5 0.01, can you always reject H0 for a 5 0.05? Explain.AppendixLO1
Critical Thinking Consider a test for m. If the P-value is such that you can reject H0 at the 5% level of significance, can you always reject H0 at the 1%level of significance? Explain.AppendixLO1
Critical Thinking Suppose that when conducting a statistical test, your hypotheses were: H0 : m 510 and H1: m , 10. If Sora had a sample mean of x 511 and River had a sample mean x 513, then which person would have a smaller P-value? Explain.AppendixLO1
Statistical Literacy After you conducted a left-tailed statistical test, you find the P-value to be 0.03. If you were to use the same information, but conducted a twotailed statistical test, what would be the P-value?AppendixLO1
Statistical Literacy If you want to show that the results of a statistical experiment show significant change; would you want a large or small P-value?AppendixLO1
Statistical Literacy To test m using a critical region method for a right-tailed test, you found the critical value z0 51.28. If you, instead, were to do a left-tailed test, what would be the new critical value?AppendixLO1
Statistical Literacy When using the Student’s t distribution to test m, what value do you use for the degrees of freedom?AppendixLO1
Statistical Literacy To test m for an x distribution that is mound-shaped using sample size n $ 30, how do you decide whether to use the normal or the Student’s t distribution?AppendixLO1
Statistical Literacy For the same sample data and null hypothesis, how does the P-value for a two-tailed test of m compare to that for a one-tailed test?AppendixLO1
Compare the critical region method to the P-value method.AppendixLO1
Test m when s is unknown using a Student’s t distribution.AppendixLO1
Test m when s is known using the normal distribution.AppendixLO1
Medical: Red Blood Cell Volume Total blood volume(in ml) per body weight (in kg) is important in medical research. For healthy adults, the red blood cell volume mean is about m 5 28 ml/kg (Reference: Laboratory and Diagnostic Tests by F. Fischbach). Red blood cell volume that is too low or too high
Insurance: Hail Damage Nationally, about 11% of the total U.S. wheat crop is destroyed each year by hail(Reference: Agricultural Statistics, U.S. Department of Agriculture). An insurance company is studying wheat hail damage claims in Weld County, Colorado. A random sample of 16 claims in Weld
Finance: P/E of Stocks The price-to-earnings (P/E)ratio is an important tool in financial work. A random sample of 14 large U.S. banks (J.P. Morgan, Bank of America, and others) gave the following P/E ratios(Reference: Forbes).24 16 22 14 12 13 17 22 15 19 23 13 11 18 The sample mean is x < 17.1.
Ecology: Hummingbirds Bill Alther is a zoologist who studies Anna’s hummingbird (Calypte anna)(Reference: Hummingbirds by K. Long and W.Alther). Suppose that in a remote part of the Grand Canyon, a random sample of six of these birds was caught, weighed, and released. The weights (in grams) were
Glucose Level: Horses Gentle Ben is a Morgan horse at a Colorado dude ranch. Over the past 8 weeks, a veterinarian took the following glucose readings from this horse (in mg/100 ml).93 88 82 105 99 110 84 89 The sample mean is x < 93.8. Let x be a random variable representing glucose readings taken
Dividend Yield: Australian Bank Stocks Let x be a random variable representing dividend yield of Australian bank stocks. We may assume that x has a normal distribution with s 5 2.4%. A random sample of 10 Australian bank stocks gave the following yields.5.7 4.8 6.0 4.9 4.0 3.4 6.5 7.1 5.3 6.1 The
Chrysler Concorde: Acceleration Consumer Reports stated that the average time for a Chrysler Concorde to go from 0 to 60 miles per hour is 8.7 seconds.(a) If you want to set up a statistical test to challenge the claim of 8.7 seconds, what would you use for the null hypothesis?(b) The town of
Meteorology: Storms Weatherwise magazine is published in association with the American Meteorological Society. Volume 46, Number 6 has a rating system to classify Nor’easter storms that frequently hit New England states and can cause much damage near the coast. A severe storm has an average peak
Marketing: Shopping Time How much a customer buys is a direct result of how much time they spend in a store. A study of average shopping times in a large chain store gave the following information:Shopping alone: 18 min.Shopping with a family: 32 min.Suppose you want to set up a statistical test to
Veterinary Science: Colts The body weight of a healthy 3-month-old colt should be about m 5 60 kg(Source: The Merck Veterinary Manual, a standard reference manual used in most veterinary colleges).(a) If you want to set up a statistical test to challenge the claim that m 5 60 kg, what would you use
Basic Computation: Find the Test Statistic, Corresponding P-value, and Conclude Test A random sample of size 16 from a normal distribution with s 5 3 produced a sample mean of 4.5.(a) Check Requirements Is the x distribution normal?Explain.(b) Compute the sample test statistic z under the null
Basic Computation: Find Test Statistic, Corresponding P-value, and Conclude Test A random sample of size 20 from a normal distribution with s 5 4 produced a sample mean of 8.(a) Check Requirements Is the x distribution normal?Explain.(b) Compute the sample test statistic z under the null hypothesis
Basic Computation: Setting Hypotheses Suppose you want to test the claim that a population mean equals 30.(a) State the null hypothesis.(b) State the alternate hypothesis if you have no information regarding how the population mean might differ from 30.(c) State the alternate hypothesis if you
Basic Computation: Setting Hypotheses Suppose you want to test the claim that a population mean equals 40.(a) State the null hypothesis.(b) State the alternate hypothesis if you have no information regarding how the population mean might differ from 40.(c) State the alternate hypothesis if you
Critical Thinking Suppose Starbucks wants to open a location in a new neighborhood, but they are only willing to spend the money if the number of daily customers is greater than 500. The hypotheses were:H0 : m 5 500 H1: m . 500(a) Explain a Type I error and its consequences.(b) Explain a Type II
Critical Thinking Suppose a criminal justice case is being conducted in which the defendant is on trial for murder. The hypotheses were:H0: The defendent is innocent.H1: The defendent is guilty.(a) Explain a Type I error and its consequences.(b) Explain a Type II error and its
Critical Thinking Explain what is problematic with setting the level of significance to 100%.AppendixLO1
Critical Thinking Explain what is wrong with this statement. The P-value is the probability of rejecting the null hypothesis.AppendixLO1
Critical Thinking Explain what is wrong with this statement. The P-value is the probability the null hypothesis is true.AppendixLO1
Statistical Literacy Suppose the P-value in a twotailed test is 0.0134. Based on the same population, sample, and null hypothesis, and assuming the test statistic z is negative, what is the P-value for a corresponding left-tailed test?AppendixLO1
Statistical Literacy Suppose the P-value in a righttailed test is 0.0092. Based on the same population, sample, and null hypothesis, what is the P-value for a corresponding two-tailed test?AppendixLO1
Statistical Literacy If the P-value in a statistical test is less than or equal to the level of significance for the test, do we reject or fail to reject H0?AppendixLO1
Statistical Literacy If the P-value in a statistical test is greater than the level of significance for the test, do we reject or fail to reject H0?AppendixLO1
Statistical Literacy What terminology do we use for the probability of rejecting the null hypothesis when it is, in fact, false?AppendixLO1
Statistical Literacy What terminology do we use for the probability of rejecting the null hypothesis when it is true? What symbol do we use for this probability? Is this the probability of a Type I or a Type II error?AppendixLO1
Statistical Literacy If we reject the null hypothesis, does this mean that we have proved it to be false beyond all doubt? Explain your answer.AppendixLO1
Statistical Literacy If we fail to reject (i.e., “accept”)the null hypothesis, does this mean that we have proved it to be true beyond all doubt? Explain your answer.AppendixLO1
Statistical Literacy In a statistical test, we have a choice of a left-tailed test, a right-tailed test, or a twotailed test. Is it the null hypothesis or the alternate hypothesis that determines which type of test is used?Explain your answer.AppendixLO1
Statistical Literacy Discuss each of the following topics in class or review the topics on your own. Then write a brief but complete essay in which you answer the following questions.(a) What is a null hypothesis H0?(b) What is an alternate hypothesis H1?(c) What is a Type I error? a Type II
Explain the risks of rejecting or not rejecting the null hypothesis.AppendixLO1
Identify types of errors, level of significance, and power of a test.AppendixLO1
Compute a P-value using a test statistic.AppendixLO1
Identify right-tailed, left-tailed, and two-tailed tests.AppendixLO1
Identify the null and alternate hypotheses in a statistical test.AppendixLO1
Describe the framework for statistical tests.AppendixLO1
How do you conduct a statistical test for the proportion p of successes in a binomial experiment?AppendixLO1
How do you conduct a statistical test for m? Does it make a difference whether m is known or unknown? (SECTION 8.2)AppendixLO1
What is the P-value of a statistical test and what does this measurement have to do with performance reliability? (SECTION 8.1)AppendixLO1
How do you decide whether to accept or reject a proposal based on sample information? (SECTION 8.1)AppendixLO1
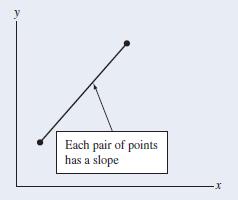
15.37 Nonparametric regression Nonparametric methods have also been devised for regression. Here’s a simple way to estimate the slope: For each pair of subjects, the slope of the line connecting their two points is the difference between their y values divided by the difference between their x
15.36 Rank-based correlation For data on two quantitative variables, x and y, an alternative correlation uses the rankings of the data. Let n denote the number of observations on the two variables. You rank the values of the x-variable from 1 to n according to their magnitudes, and you separately
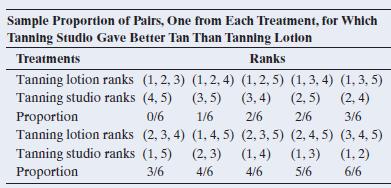
15.35 Mann-Whitney statistic For the tanning experiment, Table 15.2 showed the sampling distribution of the difference between the sample mean ranks. Suppose you instead use as a test statistic the sample proportion of pairs of participants for which the tanning studio gave a better tan than the
15.34 Multiple choice Nonparametric statistical methods are useda. Whenever the response variable is known to have a normal distribution.b. Whenever the assumptions for a parametric method are not perfectly satisfied.c. When the data are ranks for the subjects rather than quantitative measurements
15.33 True or false For a two-sided significance test comparing several means with small samples from highly skewed population distributions, it’s safer to use one-way ANOVA than a Kruskal-Wallis test. This is because the Kruskal-Wallis test assumes normal population distributions and it is not
15.32 Complete the analogy The t test for comparing two means is to the Wilcoxon test (for independent samples)as the matched pairs t test is to the __________ (for dependent samples in matched pairs).
15.31 Complete the analogy The t test for comparing two means is to the one-way ANOVA F test as the Wilcoxon test is to the __________ test.
15.30 Why matched pairs? Refer to Example 7. Describe the advantages of an experiment using a crossover design instead of independent samples to compare the tanning methods.
15.29 Why nonparametrics? Present a situation for which it’s preferable to use a nonparametric method instead of a parametric method and explain why.
Showing 800 - 900
of 6613
First
2
3
4
5
6
7
8
9
10
11
12
13
14
15
16
Last
Step by Step Answers