All Matches
Solution Library
Expert Answer
Textbooks
Search Textbook questions, tutors and Books
Oops, something went wrong!
Change your search query and then try again
Toggle navigation
FREE Trial
S
Books
FREE
Tutors
Study Help
Expert Questions
Accounting
General Management
Mathematics
Finance
Organizational Behaviour
Law
Physics
Operating System
Management Leadership
Sociology
Programming
Marketing
Database
Computer Network
Economics
Textbooks Solutions
Accounting
Managerial Accounting
Management Leadership
Cost Accounting
Statistics
Business Law
Corporate Finance
Finance
Economics
Auditing
Hire a Tutor
AI Study Help
New
Search
Search
Sign In
Register
study help
mathematics
categorical data analysis
Questions and Answers of
Categorical Data Analysis
Let yit = 1 or 0 for observation t on subject i, i = 1,..., n, t = 1, ..., T. Let y.t = ?i yit/n, yi. = ?t yit/T, and y.. = ?i ?t yit/nT. a. Regard {yi+} as fixed. Suppose that each way to allocate
Refer to the cereal diet and cholesterol study of Problem 7.18 (Table 7.23). Analyze these data with marginal models. Data from Problem 7.18: Table 7.23 refers to a study that randomly assigned
Refer to the pig farmer survey of Problem 11.7 (Table 11.1 1). Analyze these data using marginal models with all the variables.Data from Problem 11.7:Table 11.11 is from a Kansas State University
Table 11.14 is from a longitudinal study of coronary risk factors in schoolchildren (Woolson and Clarke 1984). A sample of children aged 11 ? 13 in 1977 were classified by gender and by relative
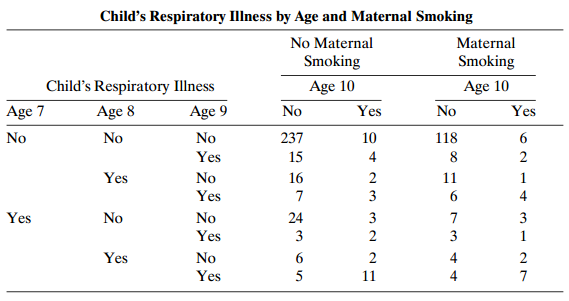
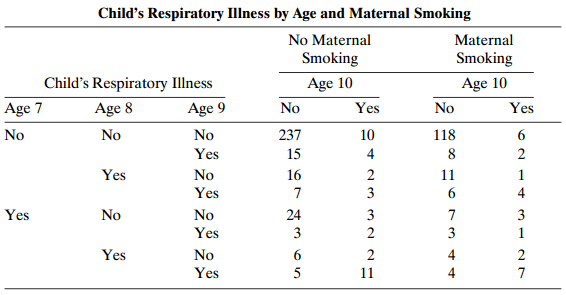
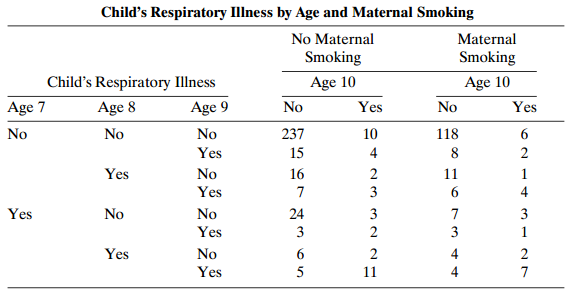
Refer to Table 11.9. Combine the data for the two levels of maternal smoking. Does a first-order Markov chain model these data adequately? Find a loglinear model that does fit adequately. Table
Find a marginal model with another type of logit that fits the insomnia data of Table 11.4 well. Interpret parameter estimates, and compare conclusions to those using cumulative logits. Table 11.4:
Table 11.10 refers to a three-period crossover trial to compare placebo (treatment A) with a low-dose analgesic (treatment B) and high-dose analgesic (treatment C) for relief of primary dysmenorrhea.
Refer to Table 9.1. Fit a marginal model to describe main effects of race, gender, and substance type (marijuana, alcohol, cigarettes) on whether a subject had used that substance. Summarize
Suppose that quasi-symmetry holds for an IT table. When the table is collapsed over a variable, show that the model holds for the IT–1 table with the same main effects.
Prove that if kth-order marginal symmetry holds, jth-order marginal symmetry holds for any j < k.
Explain how to fit the complete symmetry model in T dimensions.
A 2 × 2 table has a true odds ratio of 10. Find the cell probabilities for which (a) π1+ = π+1 = 0.5, (b) π1+ = π+1 = 0.3, and (c) π1+ = π+1 = 0.1. Find the value of kappa for each. (This
For ordered scores {ua}, let y?1 = ?a ua pa+ and y?2 = ?a ua p+a. Show that marginal homogeneity implies that E(Y?1) = E(Y?2) and estimates var(Y?1 ? Y?2). Construct a test of marginal homogeneity
A nonmodel-based ordinal measure of marginal heterogeneity is? Δ- ΣΣΡ -P +s -ΣΣ p. +P +b . a b ΣΣ&(ΣΣά.Ρ.)/ п, α b α b 2.
Construct the loglinear model satisfying both marginal homogeneity and statistical independence. Show that π̂ab = (p+a + pa+)(p+b + pb+)/4 and residual df = I(I – 1).
Show that quasi-symmetry is equivalent (Caussinus 1966) to(πab πbc πca)/(πba πcb πac) = 1 all a, b, and c.
Derive the likelihood equations and residual df for (a) symmetry, (b) quasi-symmetry, (c) quasi-independence, and (d) ordinal quasi symmetry.
Refer to Table 2.12 and Problem 2.19. Using models, describe the relationship between husband?s and wife?s sexual fun. Data from Problem 2.19: Table 2.12 summarizes responses of 91 married couples
Refer to problem 3.3 on basketball free-throw shooting. Analyze these data.Data from Prob. 3.3:In professional basketball games during 1980-1982, when Larry Bird of the Boston Celtics shot a pair of
In 1990, a sample of psychology graduate students at the University of Florida made blind, pairwise preference tests of three cola drinks. For 49 comparisons of Coke and Pepsi, Coke was preferred 29
For Problem 10.11, construct a model that describes agreement between neurologists for the two sites simultaneously. Data from Problem 10.11: Table 10.19 displays multiple sclerosis diagnoses for
Table 10.19 displays multiple sclerosis diagnoses for two neurologists who classified patients in two sites, Winnipeg and New Orleans. The diagnostic classes are (1) certain; (2) probable; (3)
For Table 10.18, use kappa to describe agreement. Interpret. Table 10.18: Son's Status 3 4 Father's Status 2 5 Total 50 28 45 174 78 18 154 223 714 129 55 96 447 411 2 3 84 110 185 495 518 1510 11
Table 10.18 relates father?s and son?s occupational status for a British sample. Analyze these data, using models of (a) symmetry, (b) quasi symmetry, (c) ordinal quasi-symmetry, (d) conditional
Refer to all four items in Table 8.19. a. Fit the complete symmetry and quasi-symmetry models. Test marginal homogeneity. Interpret. b. Fit the ordinal quasi-symmetry model. Test marginal
Explain why the RC model requires scale constraints for the scores. Show the residual df = (I – 2) (J – 2). Find and interpret the likelihood equations. Explain why the fit is invariant to
Show that the column effects model corresponds to a baseline-category logit model for Y that is linear in scores for X, with slope depending on the paired response categories.
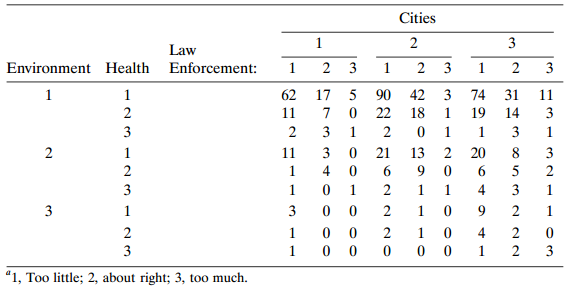
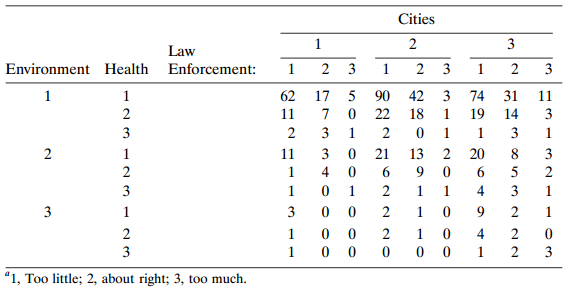
Refer to Problem 8.6. Analyze these data, using methods of this chapter. Data from Problem 8.6: Refer to Table 8.19. Subjects were asked their opinions about government spending on the environment
One hundred leukemia patients were randomly assigned to two treatments. During the study, 10 subjects on treatment A died and 18 subjects on treatment B died. The total time at risk was 170.4 years
Refer to Table 9.3. a. For the linear-by-linear association model, construct a 95% confidence interval for the odds ratio using the four corner cells. Interpret. b. Fit the column effects model.
For T categorical variables X1,..., XT, explain why:a. G2(X1, X2,..., XT) = G2(X1, X2) + G2(X1 X2, X3) + ... + G2 (X1 X2 ... XT – 1, XT).b. G2(X1 ... XT–1, XT) = G2(X1, XT) + G2(X1 XT, X1 X2) +
Analyze Table 9.9 using ordinal logit models. Interpret, and discuss advantages/disadvantages compared to loglinear analyses. Table 9.9: Cross-Classification of Mental Health Status and
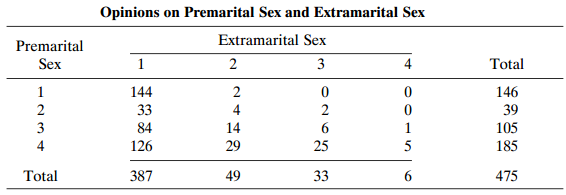
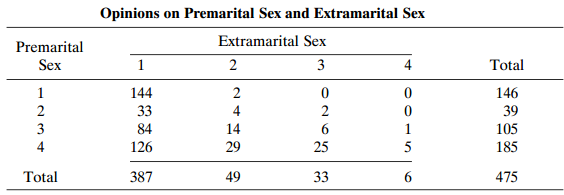
Fit the RC model to Table 9.3. Interpret the estimated scores. Does it fit better than the uniform association model? Table 9.3: Opinions about Premarital Sex and Availability of Teenage Birth
Refer to Table 7.8. Fit the homogeneous linear-by-linear association model, and interpret. Test conditional independence between income (I) and job satisfaction (S), controlling for gender (G),
A weak local association may be substantively important for nonlocal categories. Illustrate with the L ? L model for Table 9.9, showing how the estimated odd ratio for the four corner cells compares
Perform a residual analysis for the independence model with Table 3.2. Explain why it suggests that the linear-by-linear association model may fit better. Fit it, compare to the independence model,
Refer to Table 8.8. Conduct a residual analysis with the model of no three-factor interaction to describe the nature of the interaction. Table 8.8: Loglinear Models for Injury, Seat-Belt Use,
Refer to Table 2.13. Consider the nested set {(DVP), (DP, VP, DV), (VP, DV), (P, DV), (D, V, P)}. Partition chi-squared to compare the four pairs, ensuring that the overall type I error probability
Suppose that model (XY, XZ, YZ) holds in a 2 X 2 X 2 table, and the common XY conditional Log odds ratio at the two levels of Z is positive. If the XZ and YZ conditional log odds ratios are both
Suppose that X and Y are conditionally independent, given Z, and X and Z are marginally independent.a. Show that X is jointly independent of Y and Z.b. Show X and Y are marginally independent.c. Show
Standardize Table 10.6. Describe the migration patterns. Table 10.6: Migration from 1980 to 1985, with Fit of Marginal Homogeneity Model Residence in 1985 Residence in 1980 Northeast Midwest South
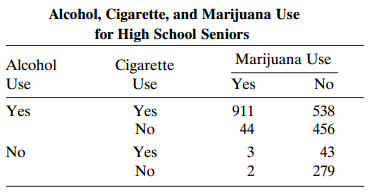
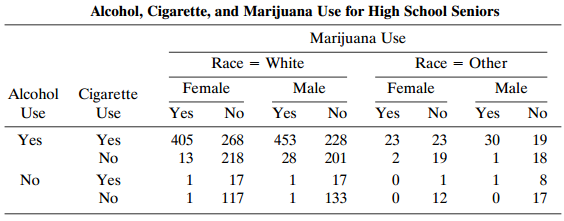
Using software, conduct the analyses described in this chapter for the student survey data (Table 8.3). Table 8.3: Alcohol, Cigarette, and Marijuana Use for High School Seniors Marijuana Use
Consider the following two-stage model for Table 8.8. The first stage is a logit model with S as the response for the three-way GLS table. The second stage is a logit model with these three variables
Why is it not optimal to fit mean response models for ordinal responses using ordinary least squares as is done for normal regression?
A response scale has the categories (strongly agree, mildly agree, mildly disagree, strongly disagree, don’t know). One way to model such a scale uses a logit model for the probability of a don’t
Suppose that we express (7.2) as exp(a; + B;x) 2-теxp(ӕ, + Bh х) п. (х) х h%=D1
Cell counts {yij} in an I × J contingency table have a multinomial (n; {πij}) distribution. Show that {P(Yij = nij), i = 1,..., I, j = 1,..., J} can be expressed aswhere αij = πij πIJ/πIJ πIJ
Refer to Table 7.17. Analyze these data. Table 7.17: Response 3 Gender Location Seat Belt Urban 7,287 11,587 3,246 6,134 10,381 10,969 6,123 6,693 10 175 126 73 94 720 577 710 No 91 48 31 Female
The book’s Web site (www.stat.ufl.edu/ ∼aa/cda/cda.html) has a 4 × 2 × 3 × 3 table that refers to a sample of residents of Copenhagen. The variables are type of housing (H), degree of contact
Analyze Table 9.5 using logit models that treat (a) party affiliation, and (b) ideology, as the response variable. Table 9.5: Observed Frequencies and Fitted Values for Political Ideology Data
Analyze Table 7.5 with each type of model studied in this chapter. Write a report summarizing results and advantages and disadvantages of each modeling strategy. Table 7.5: Life Life Mental SES
Fit a model with complementary log-log link to Table 7.20, which shows family income distributions by percent for families in the north east U.S. Interpret the difference between the income
Analyze Table 7.8 with a cumulative probit model. Compare interpretations to those in the text with other ordinal models. Table 7.8: Job Satisfaction and Income, Controlling for Gender Job
Refer to Table 7.13. Treating belief in an afterlife as ordinal, fit and interpret an ordinal model. Table 7.13: Belief in Afterlife Yes Race Gender Undecided No Female Male 371 250 49 45 White 74
Let π̂(–1) = (π̂(–1),...,π̂(–n)), where π̂(–i) denotes the estimate of E(Yi) for binary observation i after fitting the model without that observation. Cross-validation declares a
Sometimes, sample proportions are continuous rather than of the binomial form (number of successes)/(number of trials). Each observation is any real number between 0 and 1, such as the proportion of
For a multinomial distribution, let γ = ∑i bi πi, and suppose that πi = fi(θ) > 0, i = 1,..., I. For sample proportions {pi}, let S = ∑i bi pi. Let T = ∑i bi π̂i, where π̂i =
Logistic regression is applied increasingly to large financial databases, such as for credit scoring to model the influence of predictors on whether a consumer is creditworthy. The data archive found
Use the methods discussed in this chapter to select a model for Table 5.5. Table 5.5: Development of AIDS Symptoms by AZT Use and Race Symptoms Race White AZT Use Yes 14 32 11 12 No 93 81 Yes No
Consider Table 6.19, from a study of nonmetastatic osteosarcoma. The response is whether the subject achieved a three-year disease-free interval. a. Show that each predictor has a significant effect
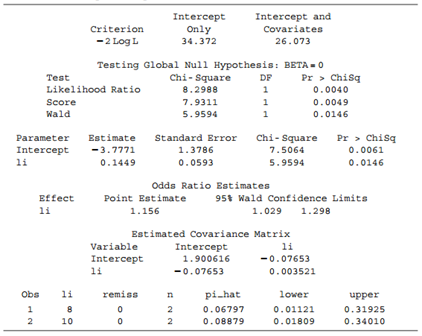
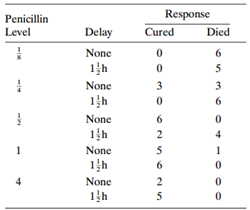
For the linear logit model with Table 3.9 and scores (0, 15, 30), conduct the exact test of H0: ? = 0 and find a point and interval estimate of ? using the conditional likelihood. Interpret. Table
Refer to Table 6.14. Fit the model having log-log link rather than complementary log-log. Test the fit. Why does it fit so poorly? Table 6.14: Beetles Killed after Exposure to Carbon Disulfide
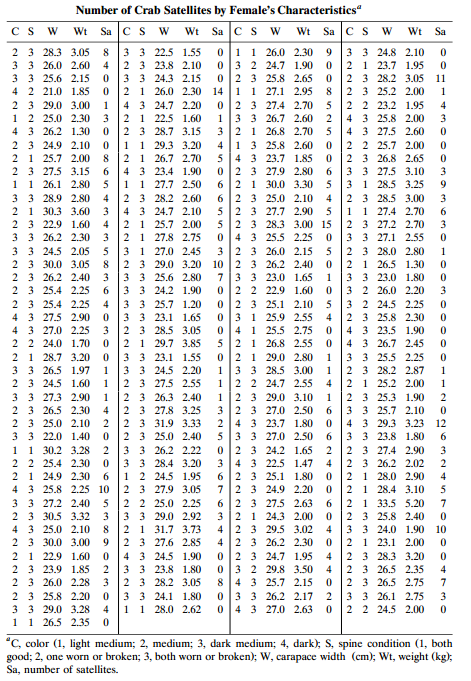
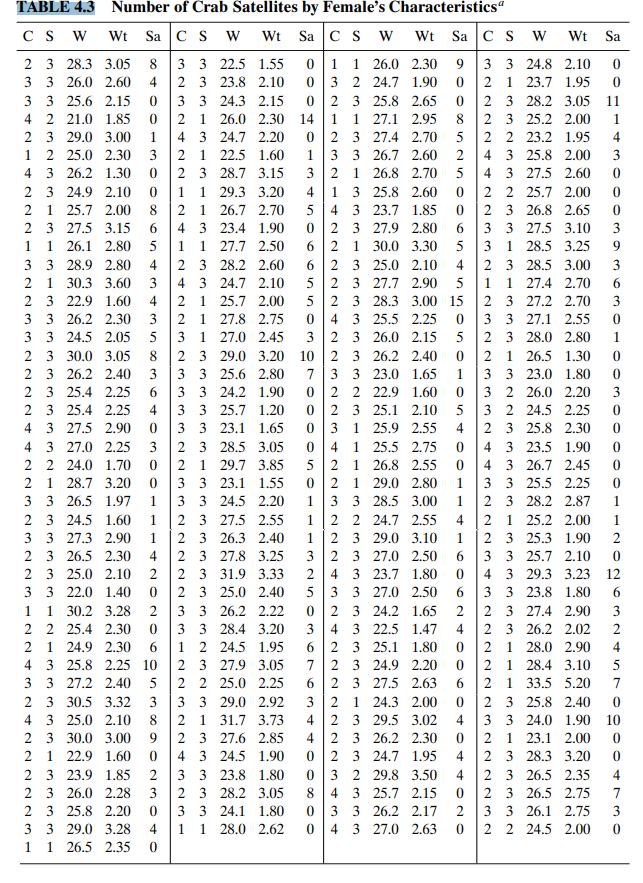
Use probit models to describe the effects of width and color on the probability of a satellite for Table 4.3. Interpret.
In an experiment designed to compare two treatments on a three-category response, a researcher expects the conditional distributions to be approximately (0.2, 0.2, 0.6) and (0.3, 0.3, 0.4).a. With α
Refer to Table 2.6. Use the CMH statistic to test independence of death penalty verdict and victim?s race, controlling for defendant?s race. Show another test of this hypothesis, and compare
Conduct a residual analysis for the independence model with Table 6.11. What type of lack of fit is indicated? Table 6.11: Change in Clinical Condition by Degree of Infiltration Degree of
Discern the reasons that Simpson?s paradox occurs for Table 6.7. Table 6.7: Data Relating Admission to Gender and Department for Model with No Gender Effect Females Males Std. Res Females Males
Refer to Table 6.4. Fit the stage 3 model denoted there by (E*P + G). Use parameter estimates to interpret the G effect and the dependence of the E effect on P. Table 6.4: Goodness of Fit of
Refer to the data for Problem 8.13. Treating opinion about premarital sex as the response variable, use backward elimination to select a model. Interpret.Data from Prob. 8.13:The book’s Web site
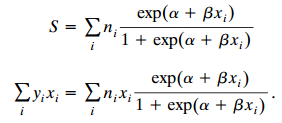
A study has ni independent binary observations {yi1,...,yini} when X = xi, i = 1,..., N, with n = ∑i ni. Consider the model logit(πi) = α + βxi, where πi = P(Yij = 1).a. Show that the kernel of
Suppose that π(x) = F(x) for some strictly increasing cdf F. Explain why a monotone transformation of x exists such that the logistic regression model holds. Generalize to alternative link functions.
Refer to Table 9.1, treating marijuana use as the response variable. Analyze these data. Table 9.1: Marijuana Use for High School Marijuana Use Alcohol, Cigarette, and Seniors Race = White Female
Fowlkes et al. (1988) reported results of a survey of employees of a large national corporation to determine how satisfaction depends on race, gender, age, and regional location. The data are at the
For Table 4.3, fit a logistic regression model for the probability of a satellite, using color alone as the predictor. a. Treat color as nominal. Explain why this model is saturated. Express its
Table 5.18 shows the results of a study about Y = whether a patient having surgery with general anesthesia experienced a sore throat on waking (0 = no, 1 = yes) as a function of the D = duration of
Model the effects of victim?s race and defendant?s race for Table 2.13. Interpret. Table 2.13: Death Penalty Victim's Defendant's Yes Race Race No White 132 White 19 Black 52 11 Black White Black 97
For Table 5.3, conduct the trend test using alcohol consumption scores (1, 2, 3, 4, 5) instead of (0.0, 0.5, 1.5, 4.0, 7.0). Compare results, noting the sensitivity to the choice of scores for highly
For noncanonical links in a GLM, show that the observed information matrix may depend on the data and hence differs from the expected information. Illustrate using the probit model.
Write a computer program using the Newton–Raphson algorithm to maximize the likelihood for a binomial sample. For π̂ = 0.3 based on n = 10, print out results of the first six iterations when the
Conditional on λ, Y has a Poisson distribution with mean λ. Values of λ vary according to gamma destiny, which has E(λ) = µ, var(λ) = µ2/k. Show that marginally Y has the negative binomial
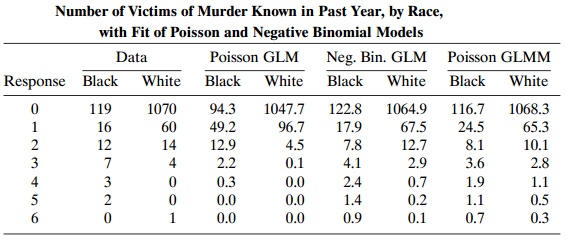
Refer to Table 13.9 on frequency of sexual intercourse. Analyze these data. Table 13.9: Response Male Female Response Male Female Response Male Female 128 65 11 13 14 2 2 13 10 3 20 17 23 10 12 13
Refer to Table 13.6. Fit a loglinear model with a dummy variable forrace, (a) assuming a Poisson distribution, and (b) allowing overdispersion with a quasi-likelihood approach. Compare
For testing H0: π1 = π2 using independent binomial variates y1 and y2? with n1 and n2 trials, the score statistic iswhere π̂ = (y1 + y2)/(n1 + n2) is the pooled estimate of π1 = π2 under H0.
For ordinal variables, consider gamma (2.14). Let Τ Σ Σ Τ aj π Σ ΣΤ + ΣΣπ aj a>i b
For two parameters, a confidence interval for θ1 − θ2, based on single-sample estimate θ̂i, and interval Show that it has the general form above of an interval for θ1 − θ2. |(ô. –
Refer to Problem 2.19 on sexual fun. Analyze these data. Present a short report summarizing results and interpretations. Data from Prob. 2.19: Table 2.12 summarizes responses of 91 married couples
Refer to Table 8.15. Obtain a 95% confidence interval for gamma. Interpret the association between schooling and attitude toward abortion. Table 8.15: Marginal Standardization of Attitudes toward
In professional basketball games during 1980-1982, when Lariy Birdof the Boston Celtics shot a pair of free throws, 5 times he missed both, 251 times he made both, 34 times he made only the first,
Refer to Table 2.5 on lung cancer and smoking. Construct a confidence interval for a relevant measure of association. Interpret. Table 2.5: Cross-Classification of Smoking by Lung Cancer Lung
Refer to Table 2.9. Construct and interpret a 95% confidence interval for the population (a) odds ratio, (b) difference of proportions, and (c) relative risk between seat-belt use and type of
Goodman and Kruskal (1954) proposed an association measure (tau) for nominal variables based on variation measure a. Show V(Y) is the probability that two independent observations on Y fall in
Refer to Problem 2.31. When all rows and columns have positive probability, show that independence is equivalent to all {αij = 1).Data from Prob. 2.31:Refer to Section 1.5.6. Using the likelihood
Show that the {aij} in (2.11) determine (a) all ) (I 2) (J 2) odds ratios formed from pairs of rows and pairs of columns, b) all {θij} in (2.10), and vice versa.
Binomial parameters for two groups are graphed, with π1 on the horizontal axis and π2 on the vertical axis. Plot the locus of points for a 2 × 2 table having (a) relative risk = 0.5, (b) odds
Table 2.13 is from an early study on the death penalty in Florida. Analyze these data and show that Simpson?s paradox occurs. Table 2.13: Death Penalty Victim's Defendant's Race Race Yes No White
Table 2.11 refers to a retrospective study of lung cancer and tobacco smoking among patients in several English hospitals. The table com pares male lung cancer patients with control patients having
State three “real-world” variables X, Y, and Z for which you expect a marginal association between X and Y but conditional independence controlling for Z.
A statistic T has discrete distribution with cdf F(t). Show that F(T) is stochastically larger than uniform over [0, 1]; that is, its cdf is every-where no greater than that of the uniform . Explain
A sample of 100 women suffer from dysmenorrhea. A new analgesic is claimed to provide greater relief than a standard one. After using each analgesic in a crossover experiment, 40 reported greater
An estimated odds ratio for adult females between the presence of squamous cell carcinoma (yes, no) and smoking behavior (smoker, nonsmoker) equals 11.7 when the smoker category has subjects whose
Showing 100 - 200
of 540
1
2
3
4
5
6