

Question: i need help with this lab work. i'm really struggling to do them Data and Calculation Tables Stock Solution Concentrations: Solution KI Na 5,03 HO
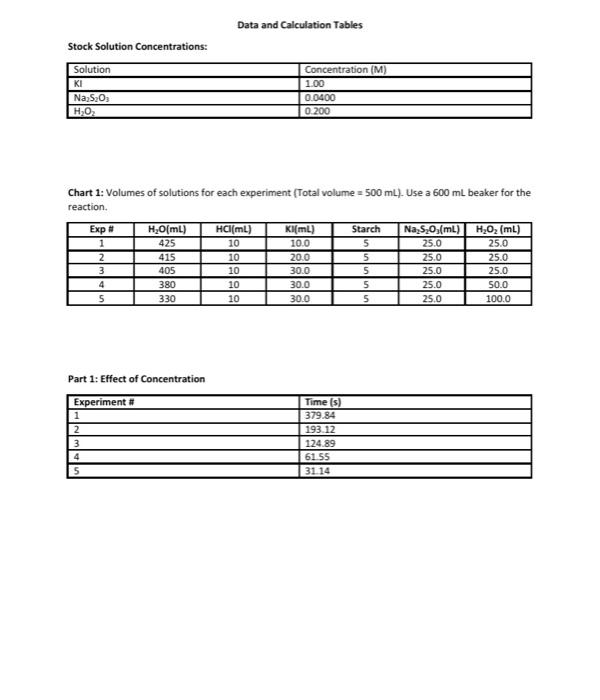
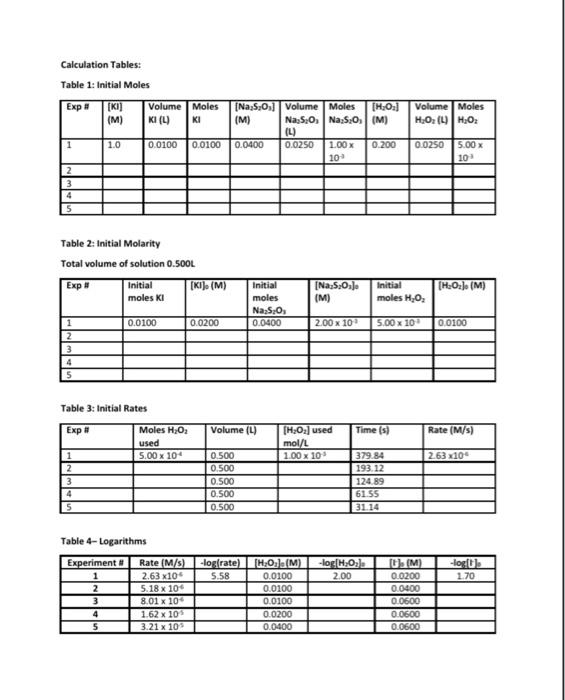
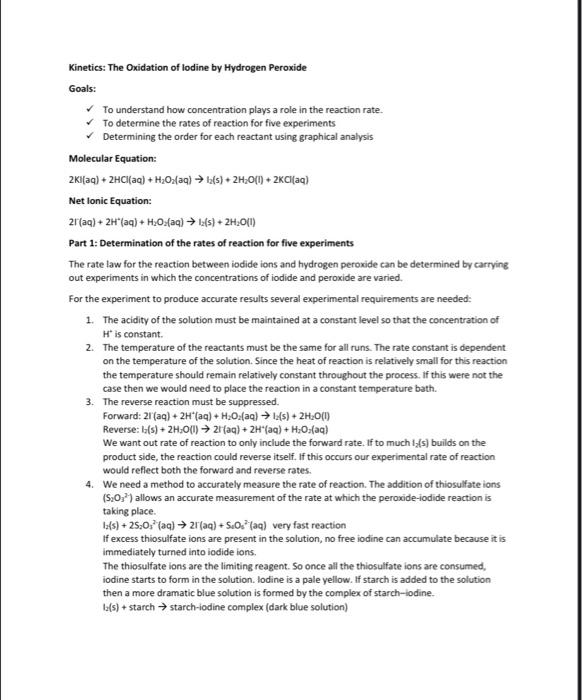
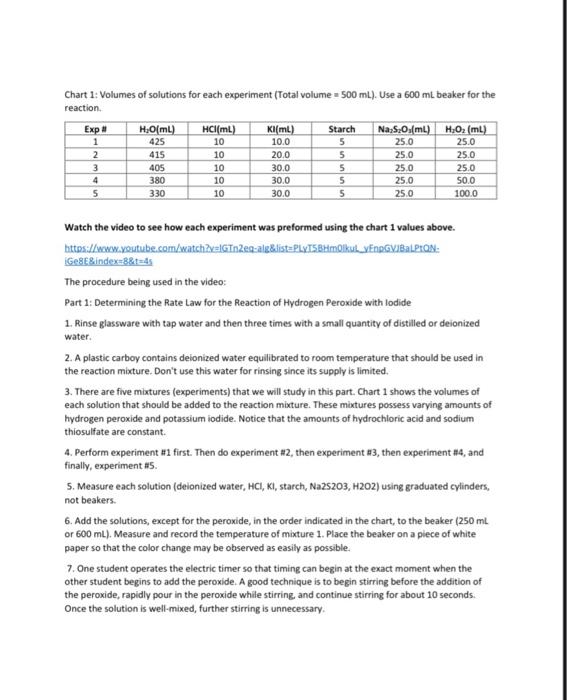
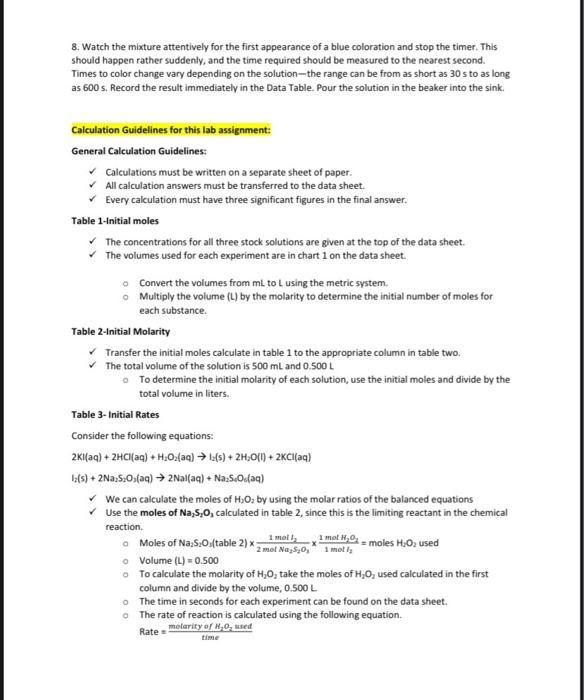
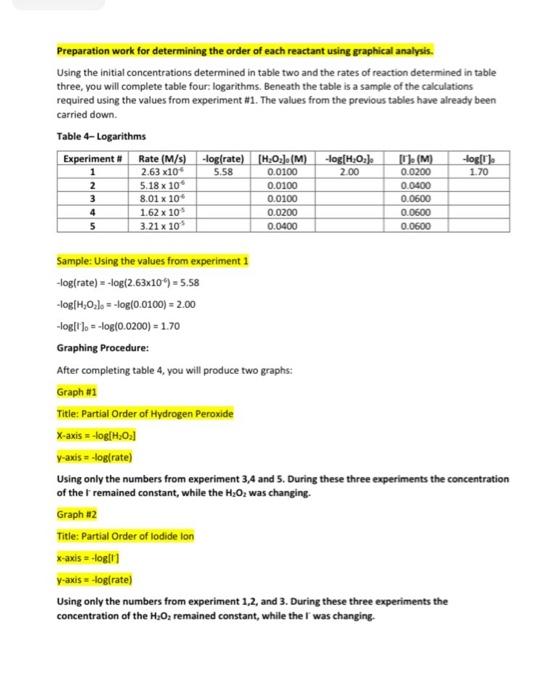
Data and Calculation Tables Stock Solution Concentrations: Solution KI Na 5,03 HO Concentration (M) 1.00 0.0400 0 200 Chart 1: Volumes of solutions for each experiment (Total volume = 500 mL). Use a 600 ml beaker for the reaction. Kl(mL) 100 20.0 Exp # 1 2 3 4 5 H2O(ml) 425 415 405 380 330 HCI(ML) 10 10 10 10 10 Starch 5 5 5 5 5 Na, S.O.(mL) 25.0 25.0 25.0 25.0 25.0 H,0, (mL) 25.0 25.0 25.0 50.0 100.0 300 30.0 30.0 Part 1: Effect of Concentration Experiment # 1 2 3 4 5 Time (s) 379.84 193.12 124.89 61 55 31 14 Volume Moles H,O, (4) H.O. Calculation Tables: Table 1: Initial Moles Exp [KI] Volume Moles [Na,s,o,] Volume Moles [H0] (M) KI (4) KI (M) Na 5:0, Na, S.(M) (L) 1 1.0 0.0100 0.0100 0.0400 0.0250 1.00 x 0.200 10 2 3 4 5 0.0250 5.00 x 10 Table 2: Initial Molarity Total volume of solution 0.5OOL Initial (KI), (M) moleski Exp Initial moles Na S. 0.0400 [Na,5,Osl (M) (H2O2). (M) Initial moles H.O. 0.0100 0.0200 2.00 x 10 5.00 x 10 0.0100 1 2 3 Volume (4) Time (s) Rate (M/s) Table 3: Initial Rates Exp Moles H202 used 1 5.00 x 10 2 3 [H202] used mol/L 1.00 x 10 263x10 0.500 0.500 0.500 0.500 0.500 379.84 193.12 124.89 61.55 3114 4 5 Table 4-Logarithms -log rate) 5.58 Experiment 1 2 3 -log(H.O.L. 2.00 -log(). 2.70 Rate (M/s) 2.63x10 5.18 x 100 8.01 x 10 1.62 x 10 3.21 x 10 fH.O.). (M) 0.0100 0.0100 0.0100 0.0200 0.0400 [M 0.0200 0.0400 0.0600 0.0600 0.0600 4 5 Kinetics: The Oxidation of lodine by Hydrogen peroxide Goals: To understand how concentration plays a role in the reaction rate. To determine the rates of reaction for five experiments Determining the order for each reactant using graphical analysis Molecular Equation: 2Kifaq) + 2HCl(aq) + H2O(aq) (s) + 2H2O(1 + 2Cl(aq) Net lonic Equation: 21 (aq) + 2H"(aq) + H2O2(aq) :(s) + 2H20(1) Part 1: Determination of the rates of reaction for five experiments The rate law for the reaction between iodide ions and hydrogen peroxide can be determined by carrying out experiments in which the concentrations of iodide and peroxide are varied. For the experiment to produce accurate results several experimental requirements are needed: 1. The acidity of the solution must be maintained at a constant level so that the concentration of #* is constant 2. The temperature of the reactants must be the same for all runs. The rate constant is dependent on the temperature of the solution. Since the heat of reaction is relatively small for this reaction the temperature should remain relatively constant throughout the process. If this were not the case then we would need to place the reaction in a constant temperature bath. 3. The reverse reaction must be suppressed. Forward: 21 (aq) + 2H+ (aq) + H2O2(aq) 145) + 2H2O(1) Reverse:1:{s) + 2H30(1) 2 (aq) + 2H"(aq) + H:O:(aq) We want out rate of reaction to only include the forward rate. If to much 1:{s) builds on the product side, the reaction could reverse itself. If this occurs our experimental rate of reaction would reflect both the forward and reverse rates. 4. We need a method to accurately measure the rate of reaction. The addition of thiosulfate ions (5,03%) allows an accurate measurement of the rate at which the peroxide-iodide reaction is taking place. 1:{s) + 25,0, (aq) 2H(aq) + 5.0. (aq) very fast reaction If excess thiosulfate ions are present in the solution, no free iodine can accumulate because it is immediately turned into iodide ions, The thiosulfate ions are the limiting reagent. So once all the thiosulfate ions are consumed, iodine starts to form in the solution. Iodine is a pale yellow. If starch is added to the solution then a more dramatic blue solution is formed by the complex of starch-iodine. la(s) + starch starch-odine complex (dark blue solution) Chart 1: Volumes of solutions for each experiment (Total volume = 500 mL). Use a 600 ml beaker for the reaction Exp # 1 2 3 4 5 H.OmL) 425 415 405 380 330 HCl(mL) 10 10 10 10 10 Kl(ml) 10.0 20.0 30.0 30.0 30.0 Starch 5 5 5 5 5 Na S.O.(mL) 25.0 25.0 25.0 25.0 25.0 H.O2 (ml) 25.0 25.0 25.0 50.0 100.0 Watch the video to see how each experiment was preformed using the chart 1 values above. https://www.youtube.com/watch?v=IGTnZeg-alg&list=PLVTSBHmolkul_VENDGVIBALPLAN: Ge8E&index=8&t=4 The procedure being used in the video: Part 1: Determining the Rate Law for the Reaction of Hydrogen peroxide with lodide 1. Rinse glassware with tap water and then three times with a small quantity of distilled or deionized water. 2. A plastic carboy contains deionized water equilibrated to room temperature that should be used in the reaction mixture. Don't use this water for rinsing since its supply is limited. 3. There are five mixtures (experiments) that we will study in this part Chart 1 shows the volumes of each solution that should be added to the reaction mixture. These mixtures possess varying amounts of hydrogen peroxide and potassium iodide. Notice that the amounts of hydrochloric acid and sodium thiosulfate are constant. 4. Perform experiment #1 first. Then do experiment #2, then experiment #3, then experiment #4, and finally, experiment #5 S. Measure each solution (deionized water, HCI, KI, starch, Na2S203, H202) using graduated cylinders, not beakers. 6. Add the solutions, except for the peroxide, in the order indicated in the chart, to the beaker (250 mL or 600 mL). Measure and record the temperature of mixture 1. Place the beaker on a piece of white paper so that the color change may be observed as easily as possible. 7. One student operates the electric timer so that timing can begin at the exact moment when the other student begins to add the peroxide. A good technique is to begin stirring before the addition of the peroxide, rapidly pour in the peroxide while stirring, and continue stirring for about 10 seconds. Once the solution is well-mixed, further stirring is unnecessary 8. Watch the mixture attentively for the first appearance of a blue coloration and stop the timer. This should happen rather suddenly, and the time required should be measured to the nearest second. Times to color change vary depending on the solution--the range can be from as short as 30 s to as long as 600 s. Record the result immediately in the Data Table. Pour the solution in the beaker into the sink Calculation Guidelines for this lab assignment: General Calculation Guidelines: Calculations must be written on a separate sheet of paper. All calculation answers must be transferred to the data sheet. Every calculation must have three significant figures in the final answer. Table 1-Initial moles The concentrations for all three stock solutions are given at the top of the data sheet. The volumes used for each experiment are in chart 1 on the data sheet. o Convert the volumes from mi to using the metric system, Multiply the volume (L) by the molarity to determine the initial number of moles for each substance Table 2-Initial Molarity Transfer the initial moles calculate in table 1 to the appropriate column in table two. The total volume of the solution is 500 mL and 0.500L To determine the initial molarity of each solution, use the initial moles and divide by the total volume in liters. Table 3- Initial Rates Consider the following equations: 2Kl(aq) + 2HCl(aq) + H.Osaq) la(s) + 2H20(1) + 2Cl(aq) 1:(s) + 2Na:5.03(aq) Nal(aq) + Na:SO (aq) We can calculate the moles of H:02 by using the molar ratios of the balanced equations Use the moles of Na,s,, calculated in table 2, since this is the limiting reactant in the chemical reaction 1 molt Moles of Na:S:Ox(table 2)x 2 mol Na 5:0,1 molts Volume (L) = 0.500 To calculate the molarity of H,0, take the moles of H 0, used calculated in the first column and divide by the volume, 0.500 L The time in seconds for each experiment can be found on the data sheet. The rate of reaction is calculated using the following equation. 1 met 8,0 = moles H:02 used Ratemalarity of H., used Preparation work for determining the order of each reactant using graphical analysis. Using the initial concentrations determined in table two and the rates of reaction determined in table three, you will complete table four: logarithms. Beneath the table is a sample of the calculations required using the values from experiment #1. The values from the previous tables have already been carried down. Table 4-Logarithms Experiment # Rate (M/s) -log(rate) [H3Oz]. (M) -log[H:02] [T (M). -oglu) 2.63 x10 0.0100 0.0200 5.18 x 10 0.0400 8.01 x 10 1.62 x 10 0.0200 3.21 x 10 5.58 200 1.70 1 2 3 4 5 0.0100 0.0100 0.0600 0.0600 0.0600 0.0400 Sample: Using the values from experiment 1 -log(rate) = -log(2.63x10% = 5.58 logiH,0;l. -log(0.0100) = 2.00 -log[') = -log(0.0200) = 1.70 Graphing Procedure: After completing table 4, you will produce two graphs: Graph #1 Title: Partial Order of Hydrogen peroxide X-axis = -log[H:01 y-axis = -logtrate) Using only the numbers from experiment 3,4 and 5. During these three experiments the concentration of the remained constant, while the H:0was changing Graph #2 Title: Partial Order of lodide lon x-axis-logli y-axis = -logtrate) Using only the numbers from experiment 1,2, and 3. During these three experiments the concentration of the H2O: remained constant, while the l' was changing Data and Calculation Tables Stock Solution Concentrations: Solution KI Na 5,03 HO Concentration (M) 1.00 0.0400 0 200 Chart 1: Volumes of solutions for each experiment (Total volume = 500 mL). Use a 600 ml beaker for the reaction. Kl(mL) 100 20.0 Exp # 1 2 3 4 5 H2O(ml) 425 415 405 380 330 HCI(ML) 10 10 10 10 10 Starch 5 5 5 5 5 Na, S.O.(mL) 25.0 25.0 25.0 25.0 25.0 H,0, (mL) 25.0 25.0 25.0 50.0 100.0 300 30.0 30.0 Part 1: Effect of Concentration Experiment # 1 2 3 4 5 Time (s) 379.84 193.12 124.89 61 55 31 14 Volume Moles H,O, (4) H.O. Calculation Tables: Table 1: Initial Moles Exp [KI] Volume Moles [Na,s,o,] Volume Moles [H0] (M) KI (4) KI (M) Na 5:0, Na, S.(M) (L) 1 1.0 0.0100 0.0100 0.0400 0.0250 1.00 x 0.200 10 2 3 4 5 0.0250 5.00 x 10 Table 2: Initial Molarity Total volume of solution 0.5OOL Initial (KI), (M) moleski Exp Initial moles Na S. 0.0400 [Na,5,Osl (M) (H2O2). (M) Initial moles H.O. 0.0100 0.0200 2.00 x 10 5.00 x 10 0.0100 1 2 3 Volume (4) Time (s) Rate (M/s) Table 3: Initial Rates Exp Moles H202 used 1 5.00 x 10 2 3 [H202] used mol/L 1.00 x 10 263x10 0.500 0.500 0.500 0.500 0.500 379.84 193.12 124.89 61.55 3114 4 5 Table 4-Logarithms -log rate) 5.58 Experiment 1 2 3 -log(H.O.L. 2.00 -log(). 2.70 Rate (M/s) 2.63x10 5.18 x 100 8.01 x 10 1.62 x 10 3.21 x 10 fH.O.). (M) 0.0100 0.0100 0.0100 0.0200 0.0400 [M 0.0200 0.0400 0.0600 0.0600 0.0600 4 5 Kinetics: The Oxidation of lodine by Hydrogen peroxide Goals: To understand how concentration plays a role in the reaction rate. To determine the rates of reaction for five experiments Determining the order for each reactant using graphical analysis Molecular Equation: 2Kifaq) + 2HCl(aq) + H2O(aq) (s) + 2H2O(1 + 2Cl(aq) Net lonic Equation: 21 (aq) + 2H"(aq) + H2O2(aq) :(s) + 2H20(1) Part 1: Determination of the rates of reaction for five experiments The rate law for the reaction between iodide ions and hydrogen peroxide can be determined by carrying out experiments in which the concentrations of iodide and peroxide are varied. For the experiment to produce accurate results several experimental requirements are needed: 1. The acidity of the solution must be maintained at a constant level so that the concentration of #* is constant 2. The temperature of the reactants must be the same for all runs. The rate constant is dependent on the temperature of the solution. Since the heat of reaction is relatively small for this reaction the temperature should remain relatively constant throughout the process. If this were not the case then we would need to place the reaction in a constant temperature bath. 3. The reverse reaction must be suppressed. Forward: 21 (aq) + 2H+ (aq) + H2O2(aq) 145) + 2H2O(1) Reverse:1:{s) + 2H30(1) 2 (aq) + 2H"(aq) + H:O:(aq) We want out rate of reaction to only include the forward rate. If to much 1:{s) builds on the product side, the reaction could reverse itself. If this occurs our experimental rate of reaction would reflect both the forward and reverse rates. 4. We need a method to accurately measure the rate of reaction. The addition of thiosulfate ions (5,03%) allows an accurate measurement of the rate at which the peroxide-iodide reaction is taking place. 1:{s) + 25,0, (aq) 2H(aq) + 5.0. (aq) very fast reaction If excess thiosulfate ions are present in the solution, no free iodine can accumulate because it is immediately turned into iodide ions, The thiosulfate ions are the limiting reagent. So once all the thiosulfate ions are consumed, iodine starts to form in the solution. Iodine is a pale yellow. If starch is added to the solution then a more dramatic blue solution is formed by the complex of starch-iodine. la(s) + starch starch-odine complex (dark blue solution) Chart 1: Volumes of solutions for each experiment (Total volume = 500 mL). Use a 600 ml beaker for the reaction Exp # 1 2 3 4 5 H.OmL) 425 415 405 380 330 HCl(mL) 10 10 10 10 10 Kl(ml) 10.0 20.0 30.0 30.0 30.0 Starch 5 5 5 5 5 Na S.O.(mL) 25.0 25.0 25.0 25.0 25.0 H.O2 (ml) 25.0 25.0 25.0 50.0 100.0 Watch the video to see how each experiment was preformed using the chart 1 values above. https://www.youtube.com/watch?v=IGTnZeg-alg&list=PLVTSBHmolkul_VENDGVIBALPLAN: Ge8E&index=8&t=4 The procedure being used in the video: Part 1: Determining the Rate Law for the Reaction of Hydrogen peroxide with lodide 1. Rinse glassware with tap water and then three times with a small quantity of distilled or deionized water. 2. A plastic carboy contains deionized water equilibrated to room temperature that should be used in the reaction mixture. Don't use this water for rinsing since its supply is limited. 3. There are five mixtures (experiments) that we will study in this part Chart 1 shows the volumes of each solution that should be added to the reaction mixture. These mixtures possess varying amounts of hydrogen peroxide and potassium iodide. Notice that the amounts of hydrochloric acid and sodium thiosulfate are constant. 4. Perform experiment #1 first. Then do experiment #2, then experiment #3, then experiment #4, and finally, experiment #5 S. Measure each solution (deionized water, HCI, KI, starch, Na2S203, H202) using graduated cylinders, not beakers. 6. Add the solutions, except for the peroxide, in the order indicated in the chart, to the beaker (250 mL or 600 mL). Measure and record the temperature of mixture 1. Place the beaker on a piece of white paper so that the color change may be observed as easily as possible. 7. One student operates the electric timer so that timing can begin at the exact moment when the other student begins to add the peroxide. A good technique is to begin stirring before the addition of the peroxide, rapidly pour in the peroxide while stirring, and continue stirring for about 10 seconds. Once the solution is well-mixed, further stirring is unnecessary 8. Watch the mixture attentively for the first appearance of a blue coloration and stop the timer. This should happen rather suddenly, and the time required should be measured to the nearest second. Times to color change vary depending on the solution--the range can be from as short as 30 s to as long as 600 s. Record the result immediately in the Data Table. Pour the solution in the beaker into the sink Calculation Guidelines for this lab assignment: General Calculation Guidelines: Calculations must be written on a separate sheet of paper. All calculation answers must be transferred to the data sheet. Every calculation must have three significant figures in the final answer. Table 1-Initial moles The concentrations for all three stock solutions are given at the top of the data sheet. The volumes used for each experiment are in chart 1 on the data sheet. o Convert the volumes from mi to using the metric system, Multiply the volume (L) by the molarity to determine the initial number of moles for each substance Table 2-Initial Molarity Transfer the initial moles calculate in table 1 to the appropriate column in table two. The total volume of the solution is 500 mL and 0.500L To determine the initial molarity of each solution, use the initial moles and divide by the total volume in liters. Table 3- Initial Rates Consider the following equations: 2Kl(aq) + 2HCl(aq) + H.Osaq) la(s) + 2H20(1) + 2Cl(aq) 1:(s) + 2Na:5.03(aq) Nal(aq) + Na:SO (aq) We can calculate the moles of H:02 by using the molar ratios of the balanced equations Use the moles of Na,s,, calculated in table 2, since this is the limiting reactant in the chemical reaction 1 molt Moles of Na:S:Ox(table 2)x 2 mol Na 5:0,1 molts Volume (L) = 0.500 To calculate the molarity of H,0, take the moles of H 0, used calculated in the first column and divide by the volume, 0.500 L The time in seconds for each experiment can be found on the data sheet. The rate of reaction is calculated using the following equation. 1 met 8,0 = moles H:02 used Ratemalarity of H., used Preparation work for determining the order of each reactant using graphical analysis. Using the initial concentrations determined in table two and the rates of reaction determined in table three, you will complete table four: logarithms. Beneath the table is a sample of the calculations required using the values from experiment #1. The values from the previous tables have already been carried down. Table 4-Logarithms Experiment # Rate (M/s) -log(rate) [H3Oz]. (M) -log[H:02] [T (M). -oglu) 2.63 x10 0.0100 0.0200 5.18 x 10 0.0400 8.01 x 10 1.62 x 10 0.0200 3.21 x 10 5.58 200 1.70 1 2 3 4 5 0.0100 0.0100 0.0600 0.0600 0.0600 0.0400 Sample: Using the values from experiment 1 -log(rate) = -log(2.63x10% = 5.58 logiH,0;l. -log(0.0100) = 2.00 -log[') = -log(0.0200) = 1.70 Graphing Procedure: After completing table 4, you will produce two graphs: Graph #1 Title: Partial Order of Hydrogen peroxide X-axis = -log[H:01 y-axis = -logtrate) Using only the numbers from experiment 3,4 and 5. During these three experiments the concentration of the remained constant, while the H:0was changing Graph #2 Title: Partial Order of lodide lon x-axis-logli y-axis = -logtrate) Using only the numbers from experiment 1,2, and 3. During these three experiments the concentration of the H2O: remained constant, while the l' was changing
Step by Step Solution
There are 3 Steps involved in it

Get step-by-step solutions from verified subject matter experts